Waterfall Chart Excel Template
$9.00
Available in stock
Already have an account? Login
Add to cart| Available Formats | MS Excel |
|---|
Description
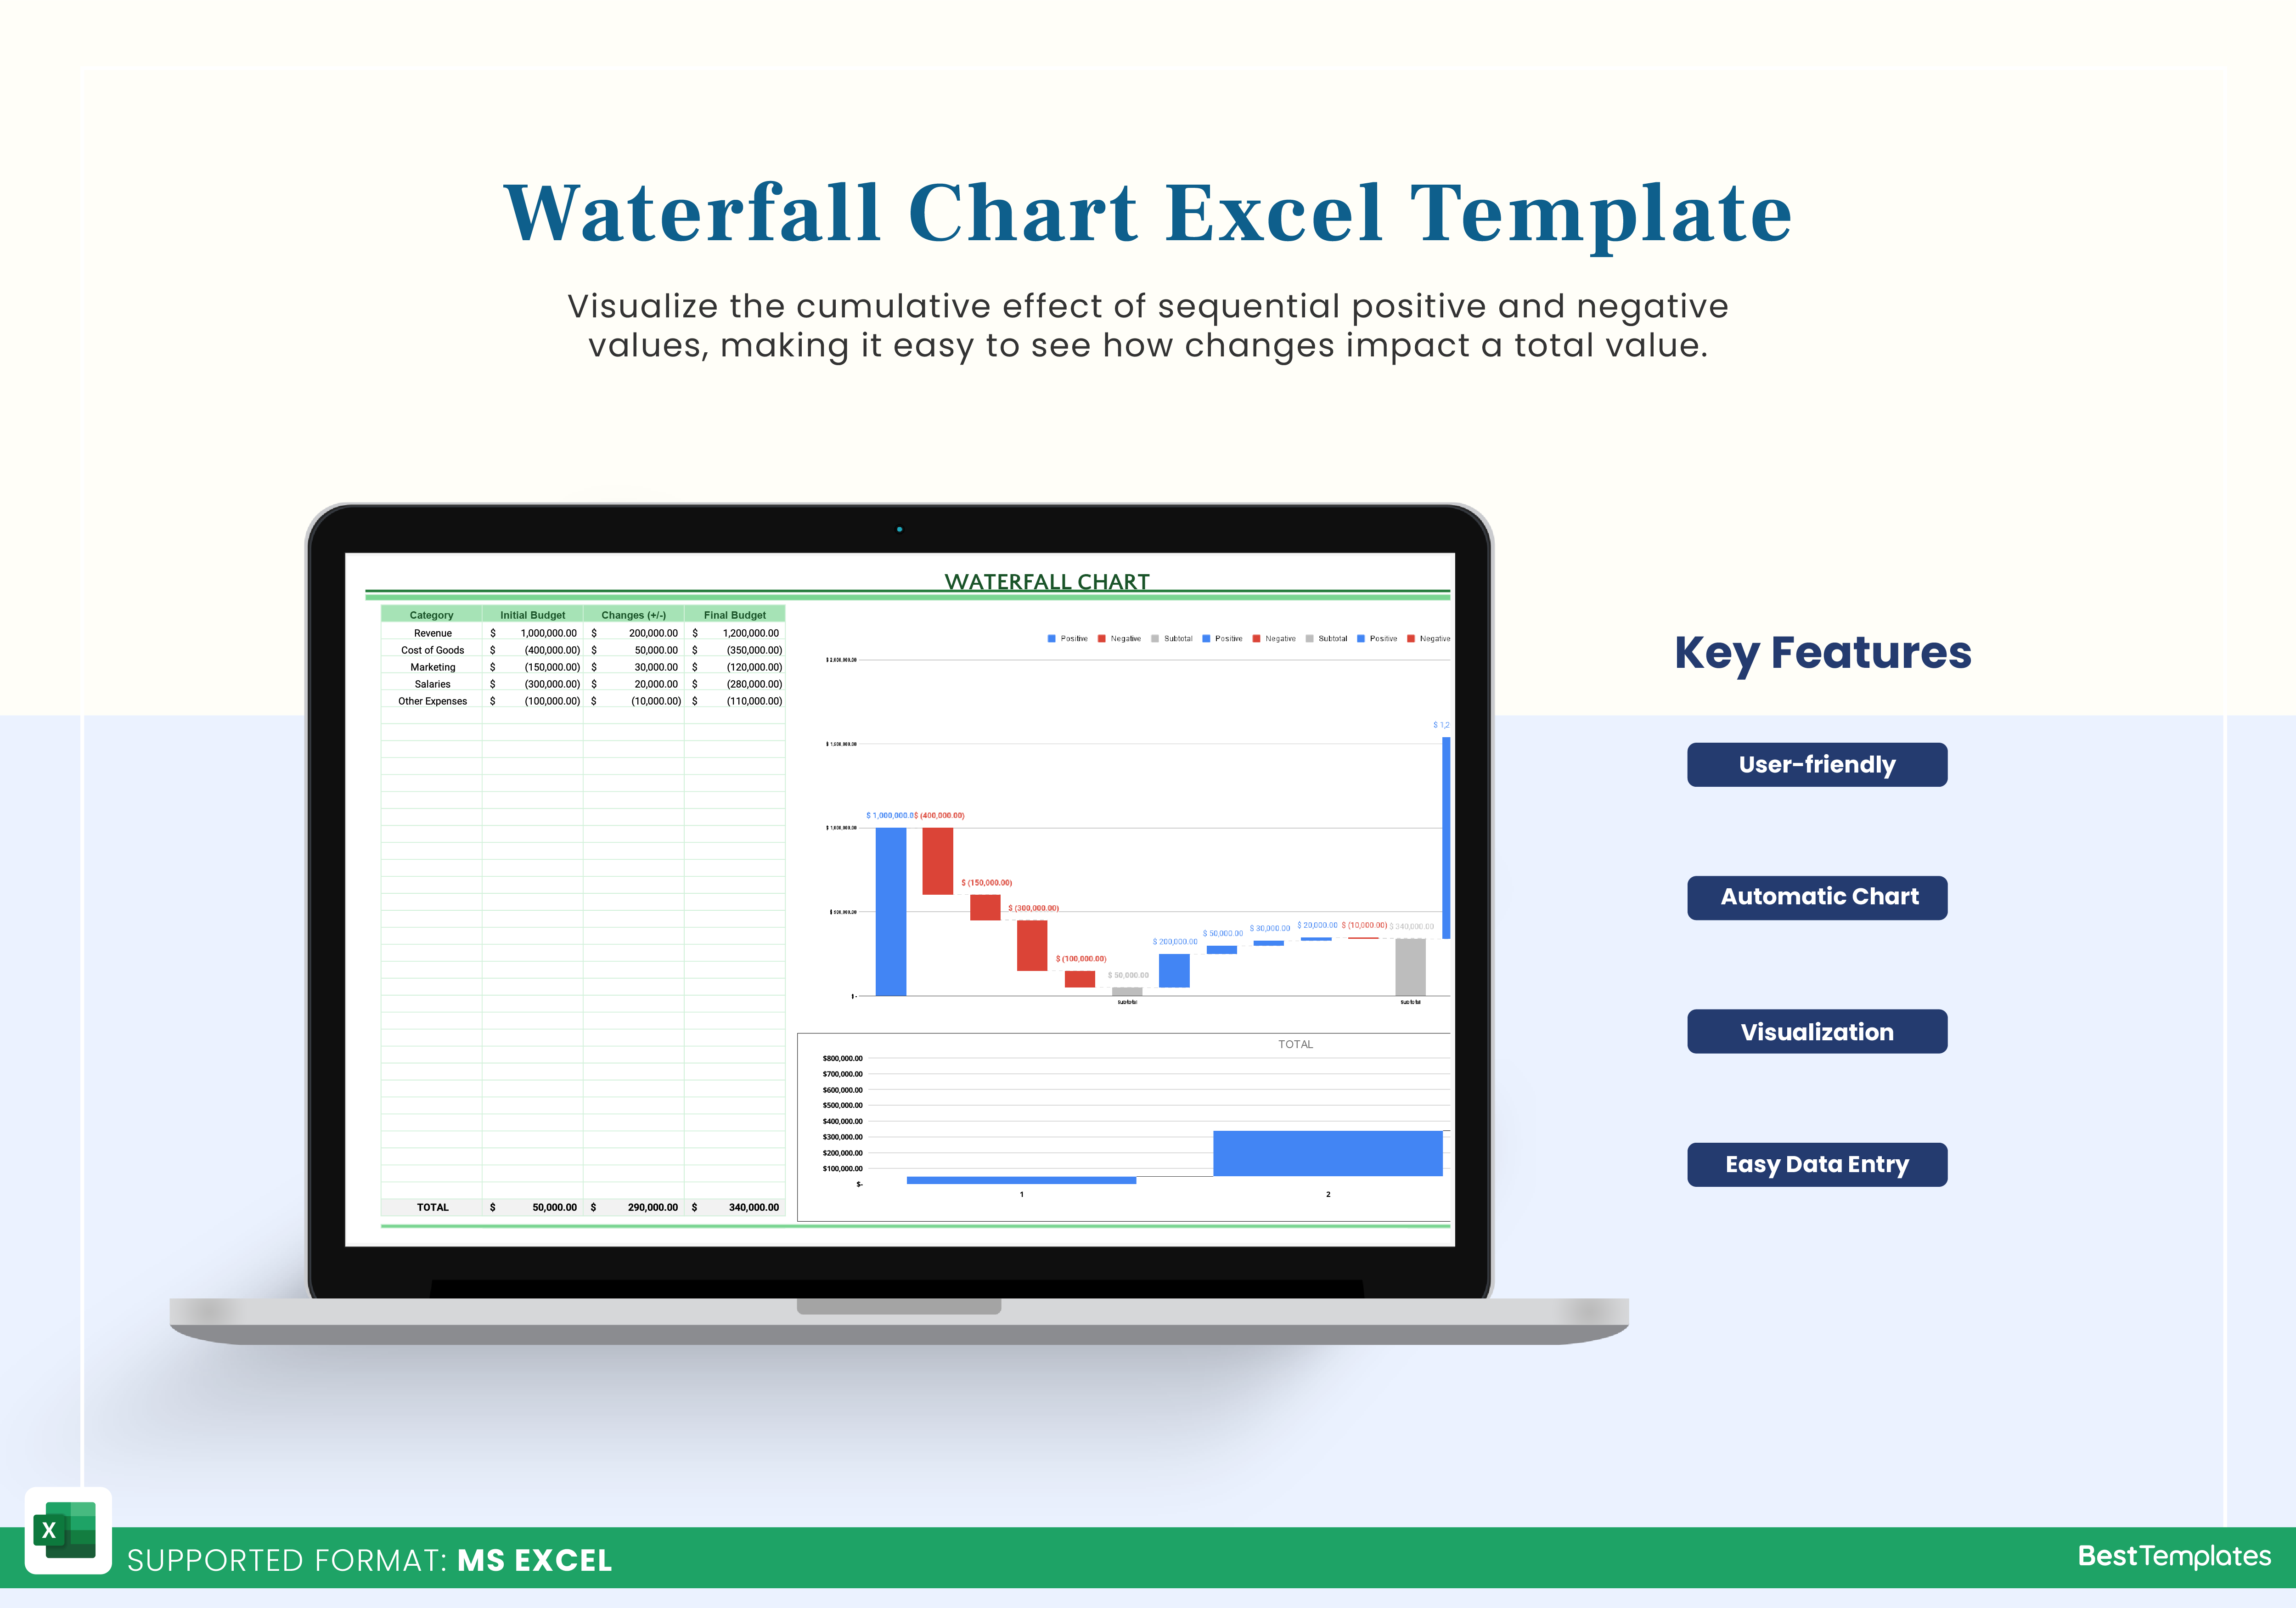
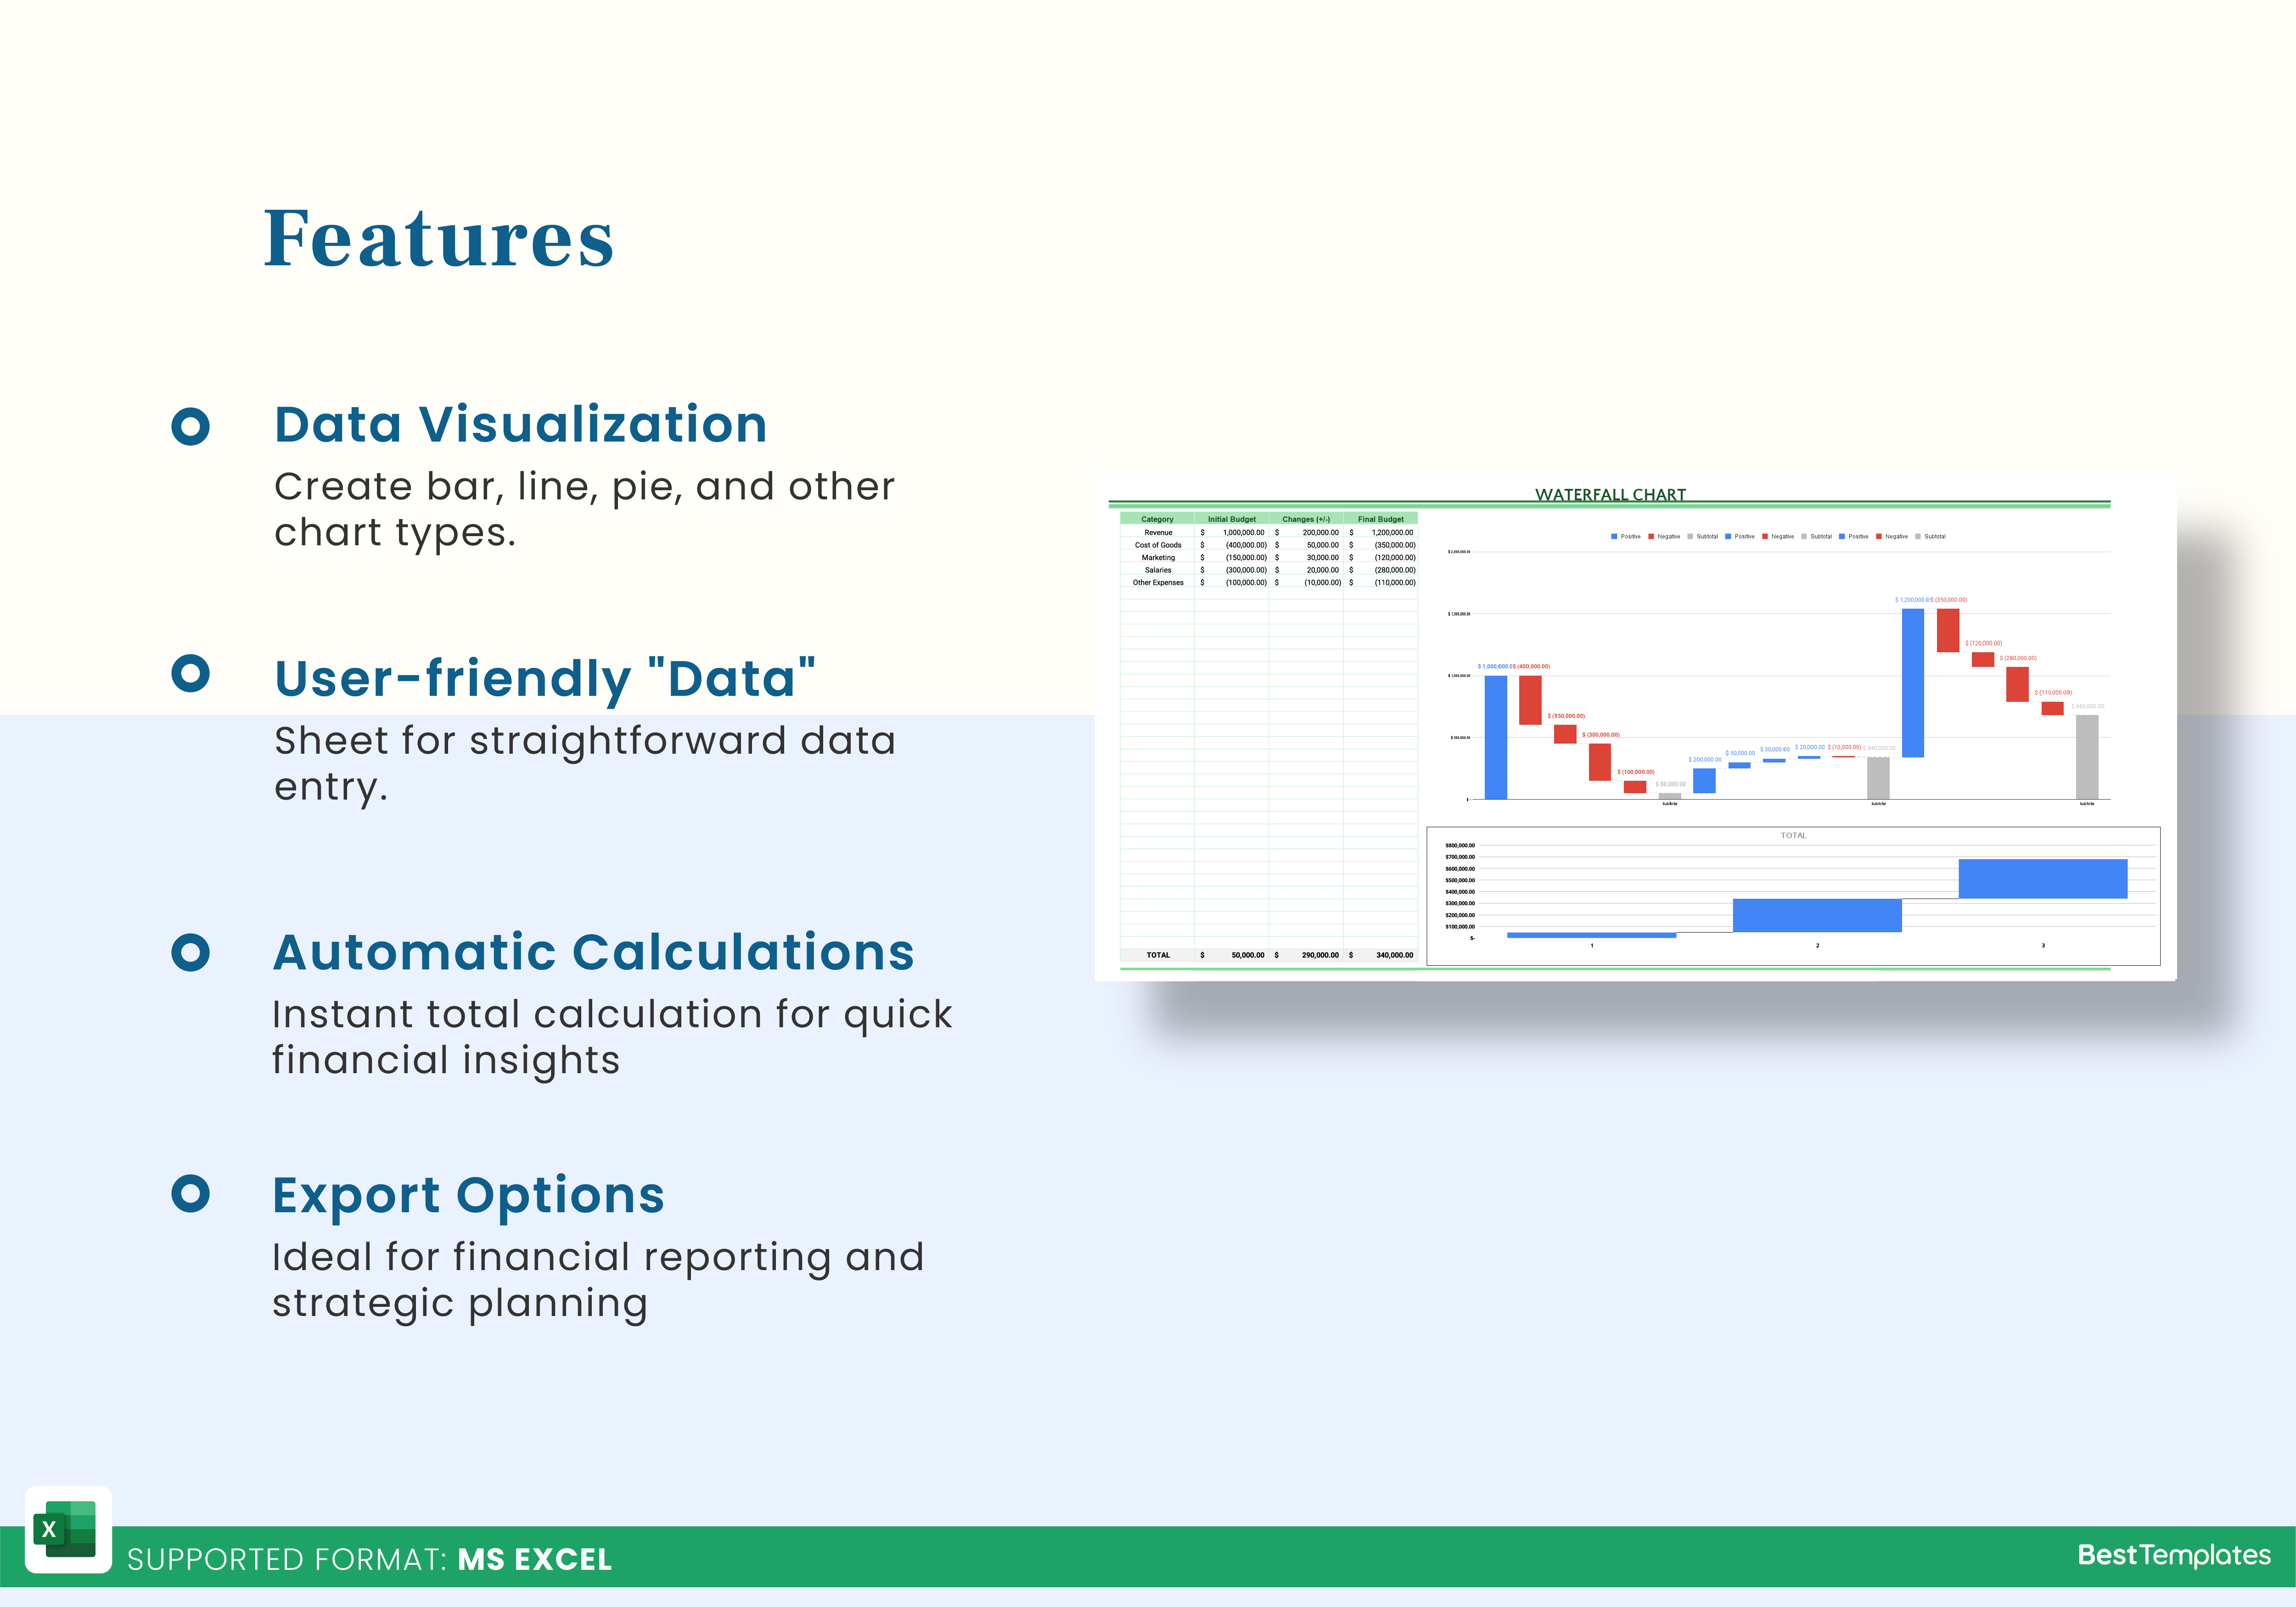
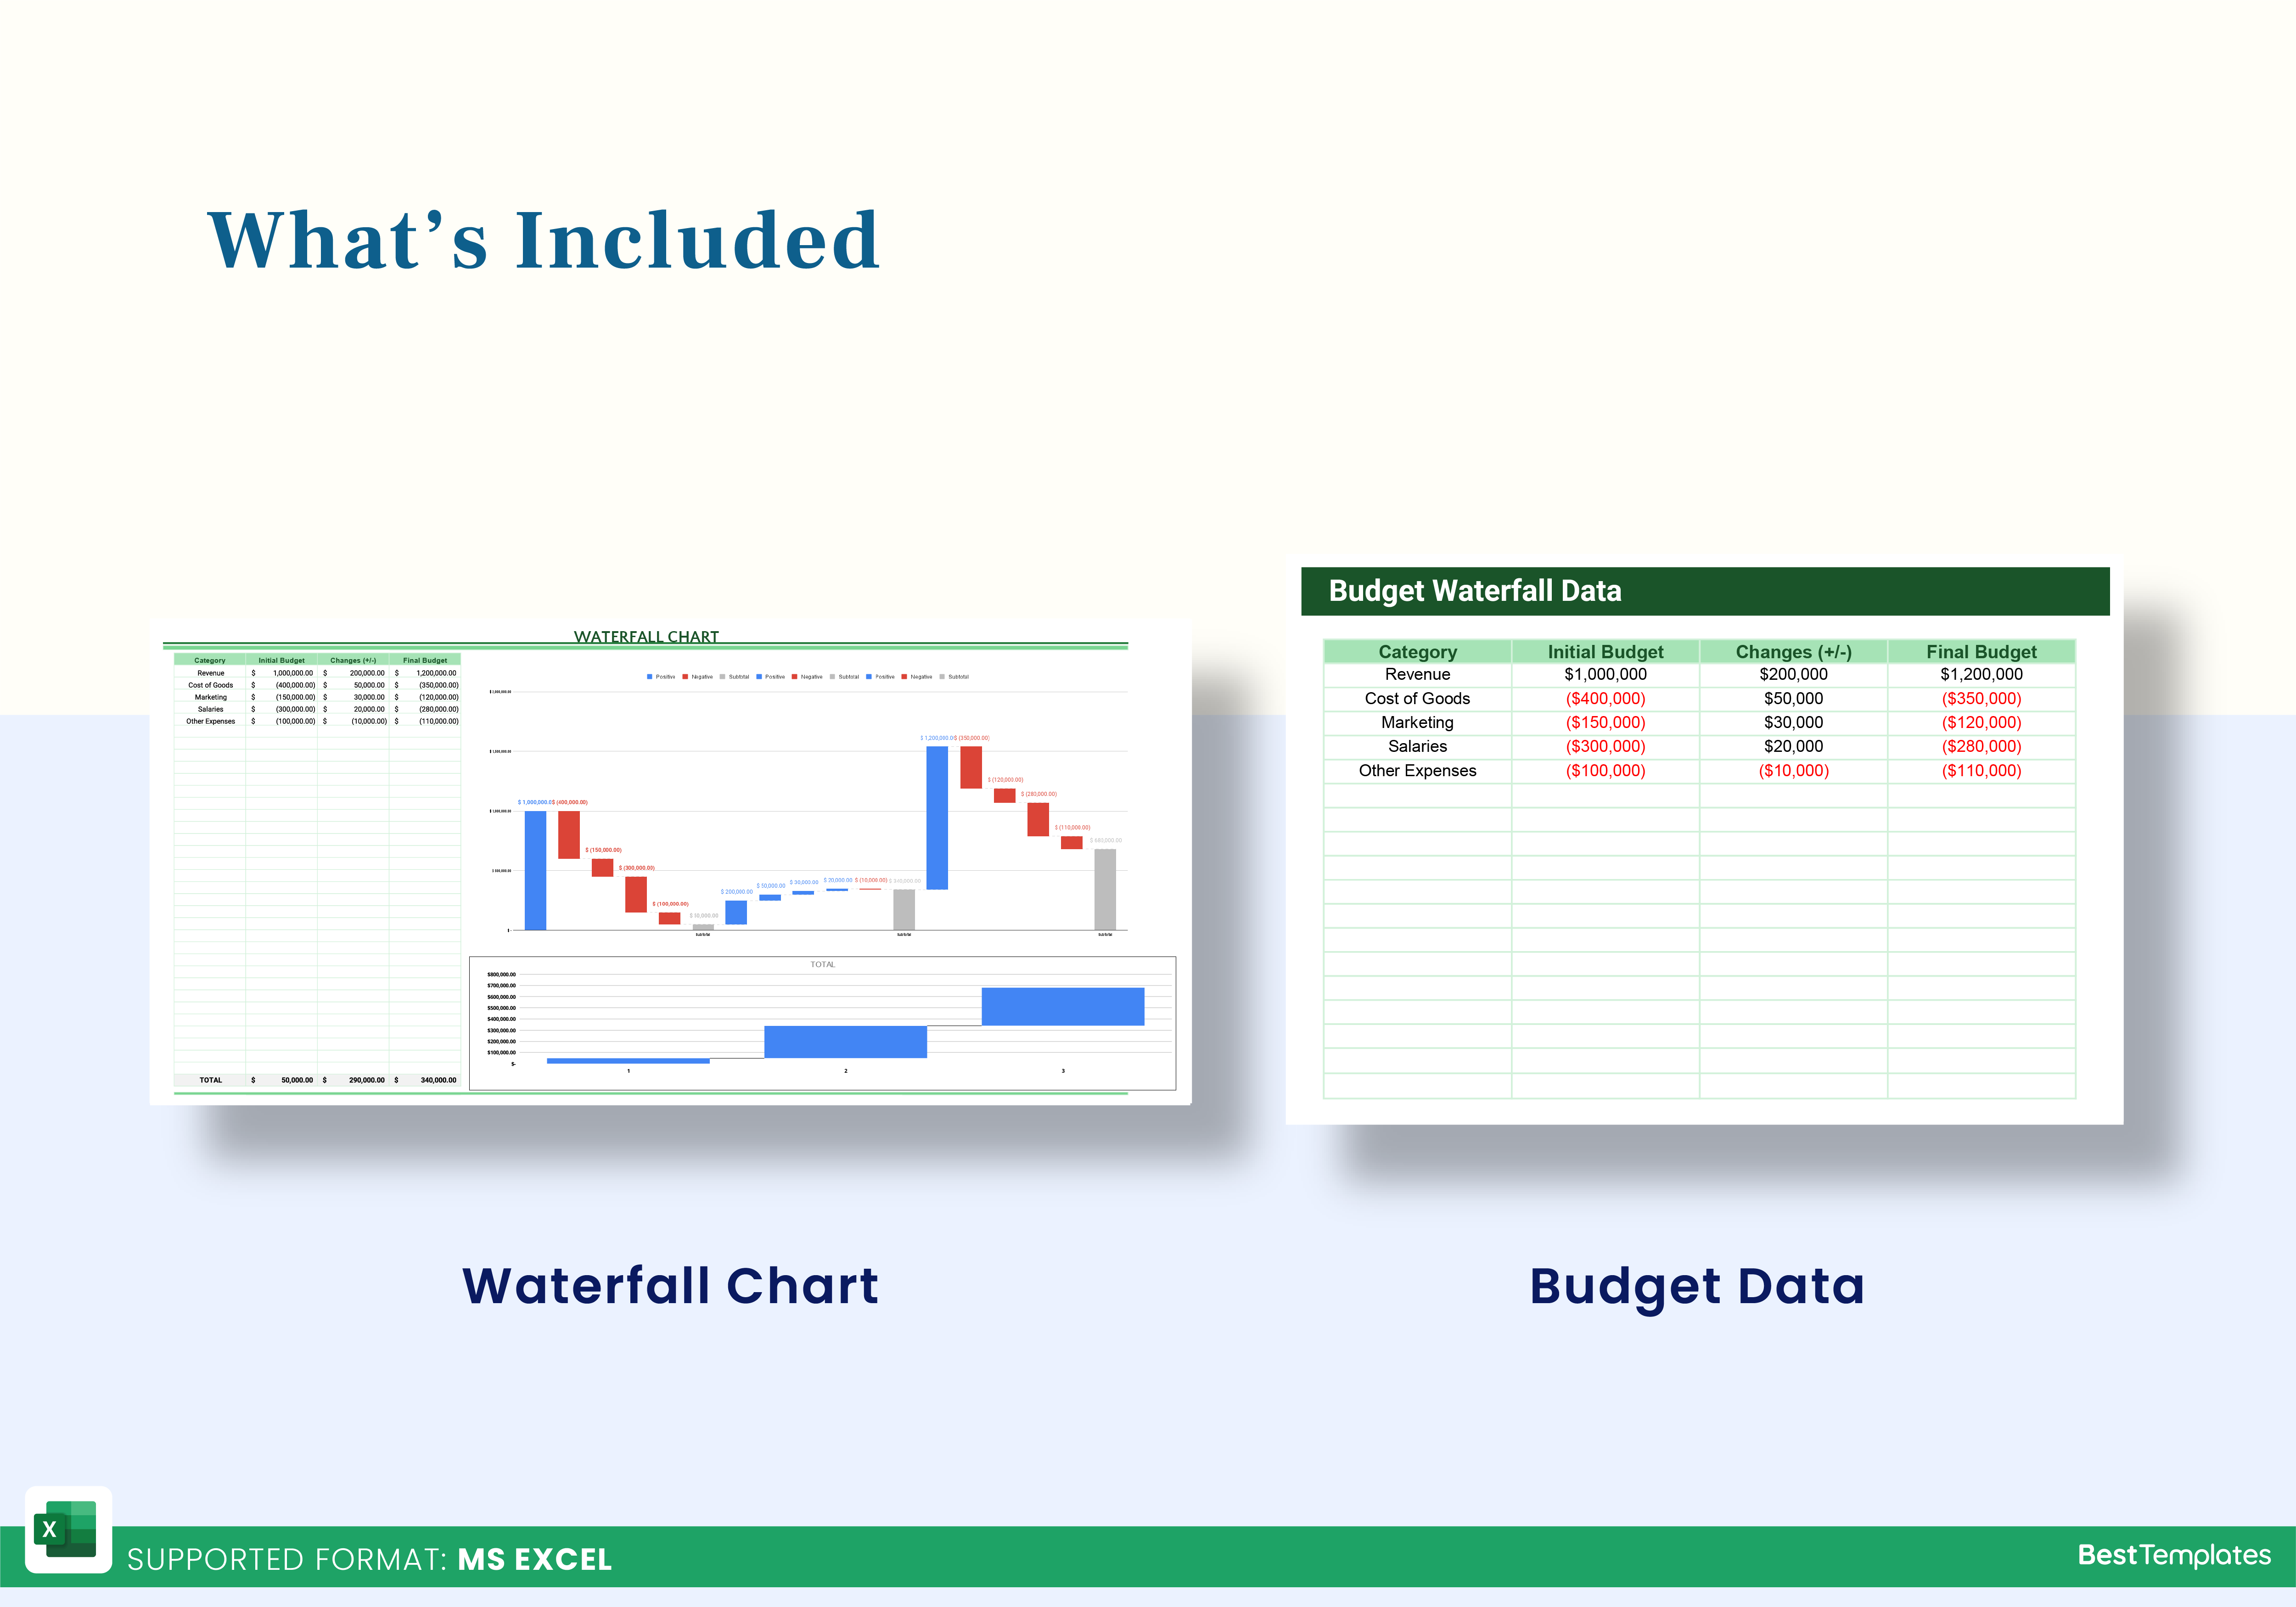
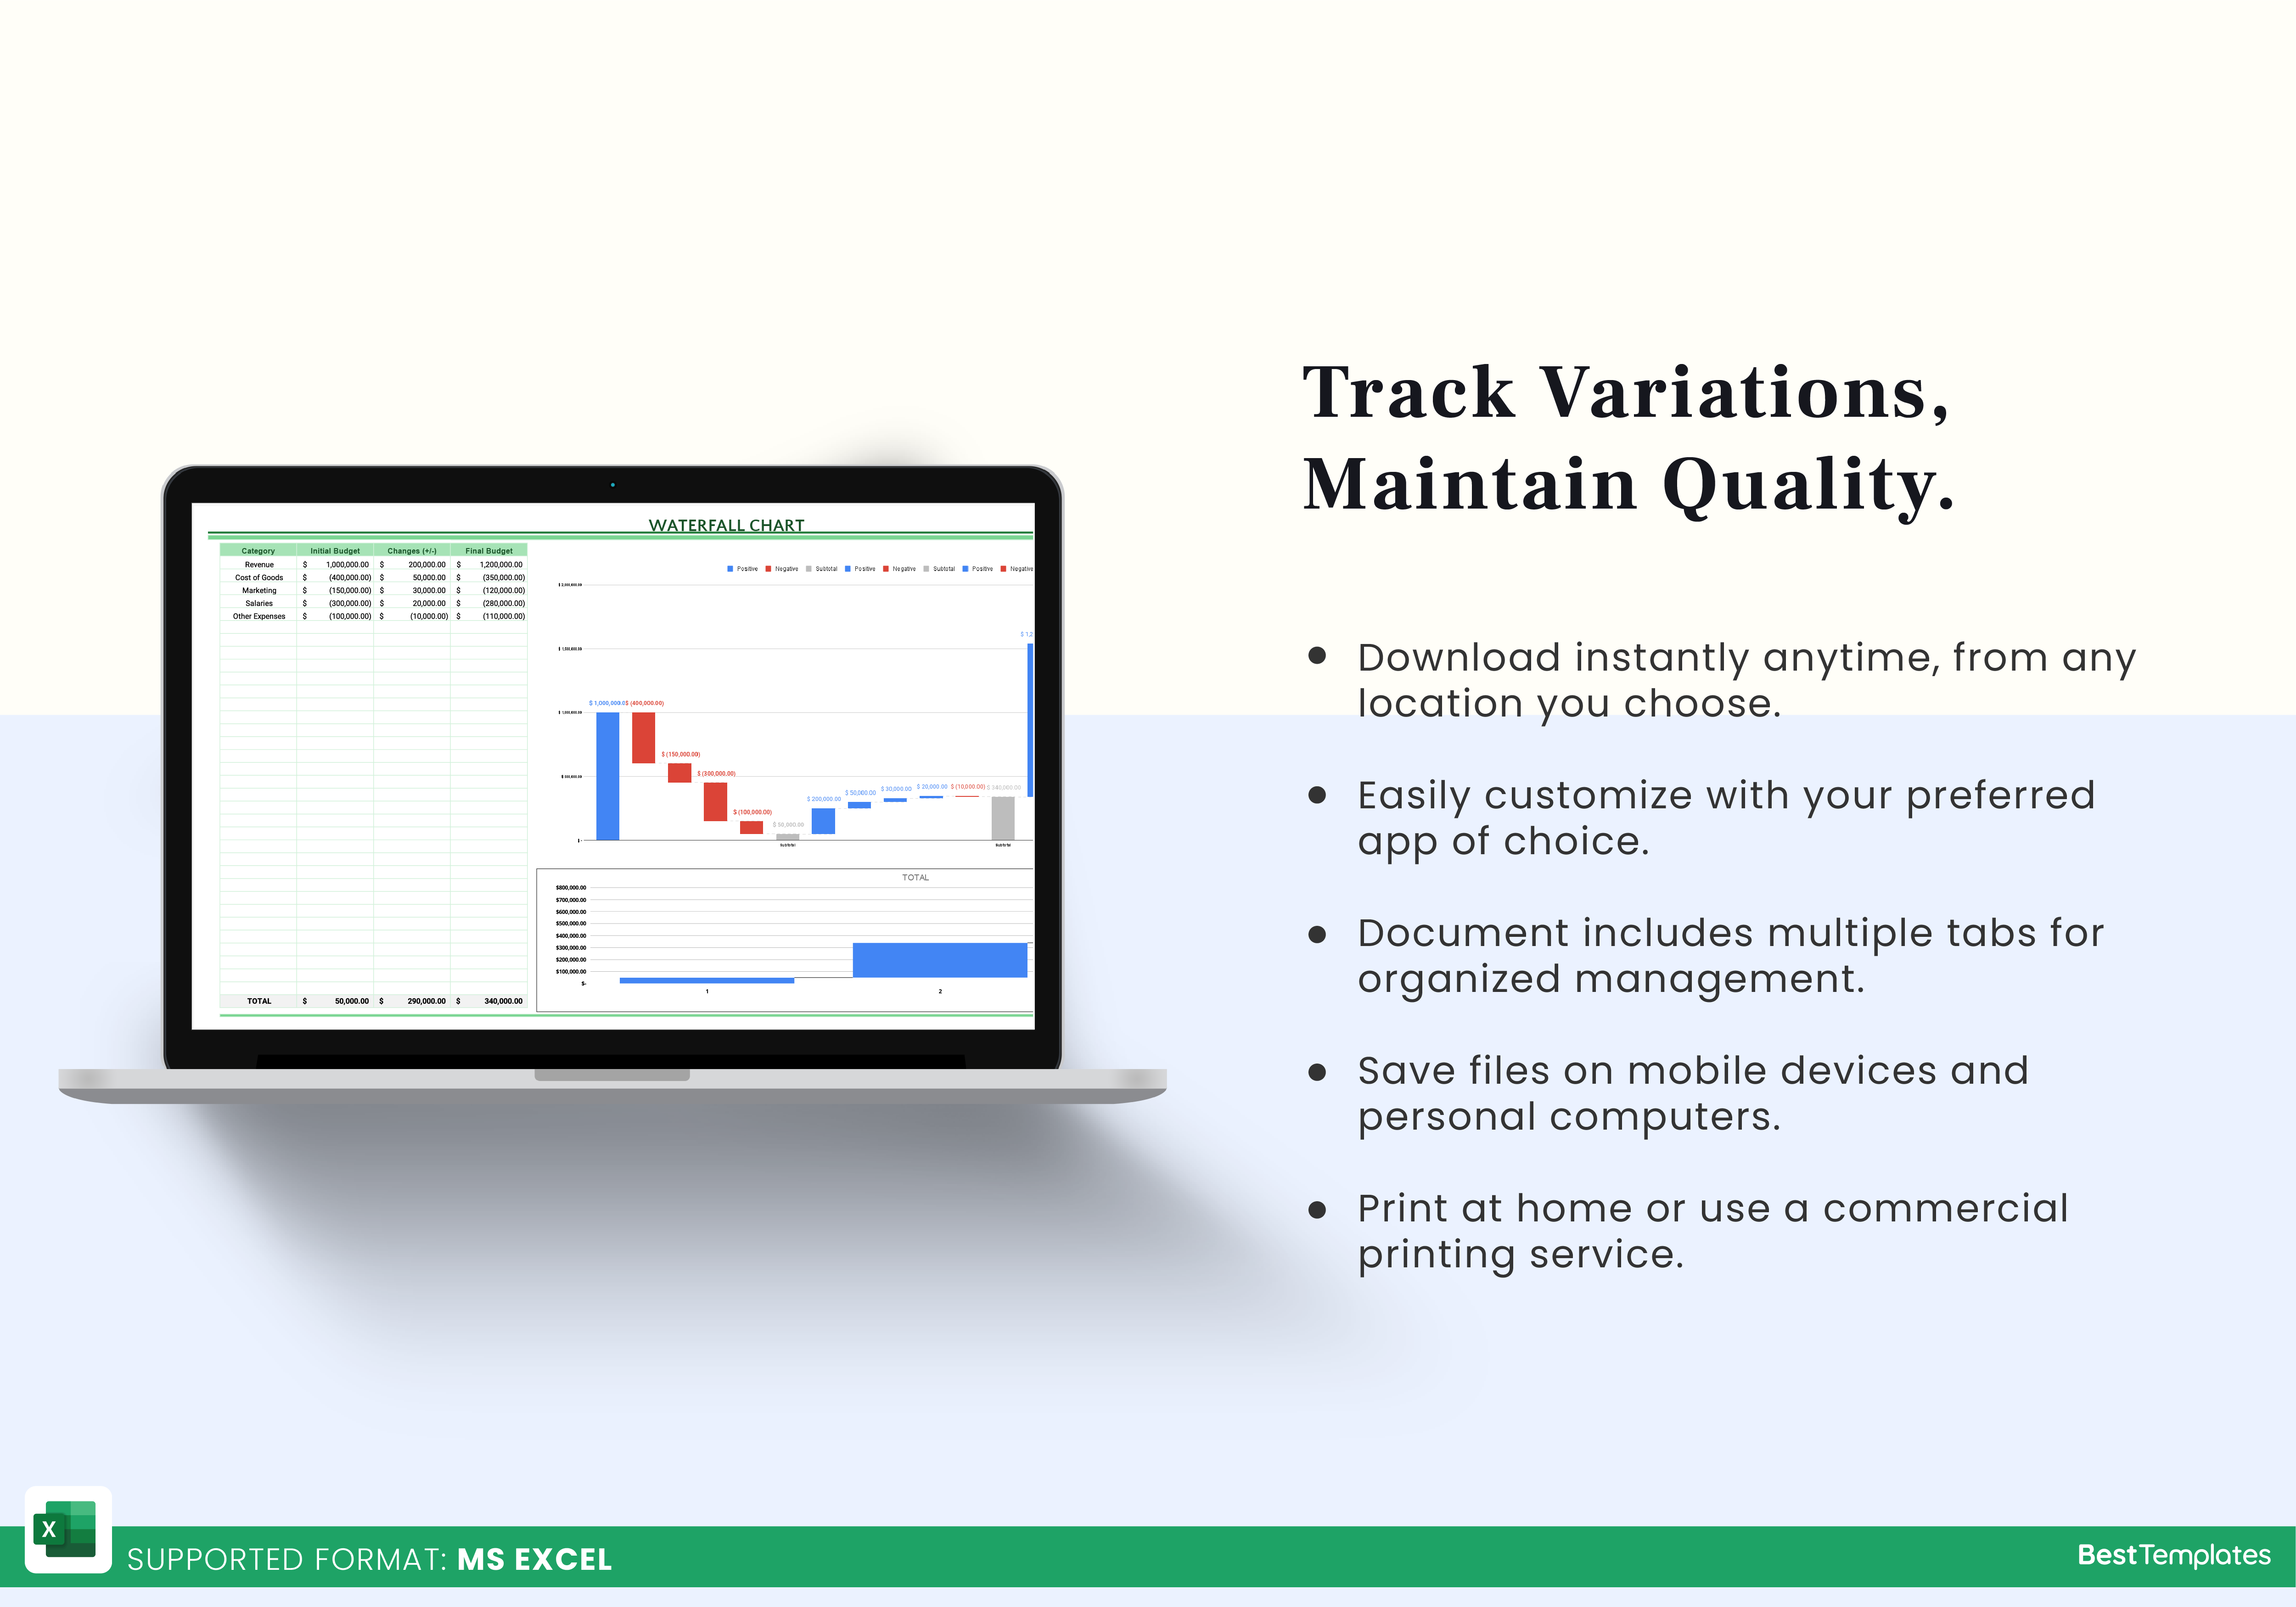
Unlock the power of data visualization with the Waterfall Chart Excel Template from Besttemplates.com. This essential tool is perfect for professionals who need to analyze financial data and clearly illustrate how different factors contribute to overall totals. In the “Data” sheet, you can input your data based on specific parameters, making it easy to track both gains and losses. Once your data is entered, simply switch to the “Waterfall Chart” sheet, where you can select a category name, and the relevant details will automatically filter and display. This intuitive design ensures that you spend less time organizing data and more time analyzing results. The total is calculated automatically, providing you with instant insights into your financial performance. Additionally, the template includes charts for effective visualization and analysis, allowing you to present complex information in an easily digestible format.
Key Features:
- User-friendly “Data” sheet for straightforward data entry
- Automatic filtering of details in the “Waterfall Chart” sheet
- Instant total calculation for quick financial insights
- Comprehensive charts for enhanced visualization and analysis
- Ideal for financial reporting and strategic planning
With the Waterfall Chart Excel Template from Besttemplates.com, you can transform your financial data into impactful visuals, facilitating better communication of insights and informed decision-making.
Additional Information
| Available Formats | MS Excel |
|---|
Additional Product Info
- Compatibility: Excel 2013, 2016, 2019, 2021, Office 365
- Functionality: No VBA Macros or custom scripts needed
- Orientation Options: Portrait/Landscape
- Color Mode: RGB Color Space
- License Type: Standard License
- Customization: Easily editable and customizable
- Font Style: Business standard fonts are used
- Digital Optimization: Optimized for digital use only
- Printing Suitability: Suitable for printing


 No products in the cart.