Scatter Plot Excel Template
$9.00
Available in stock
Already have an account? Login
Add to cart| Available Formats | MS Excel |
|---|---|
| Sub Category | Charts |
Description
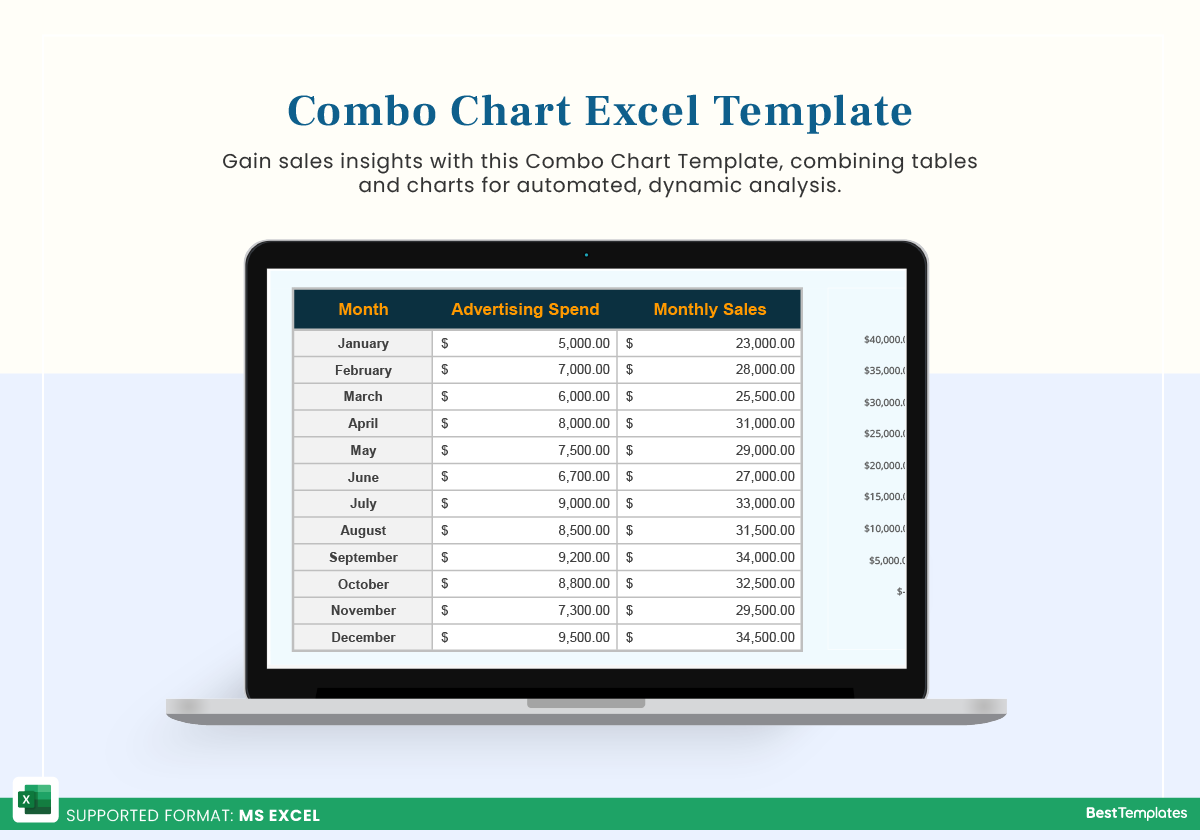
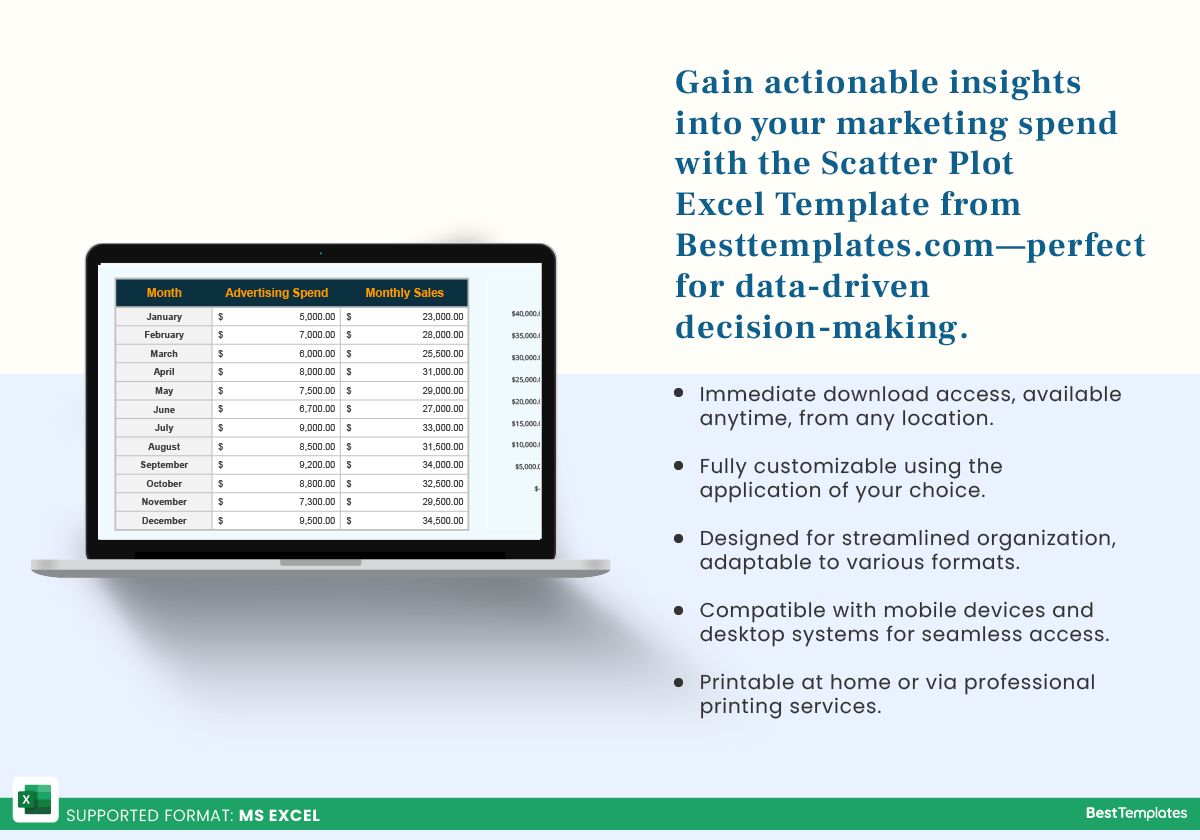
Visualize the relationship between advertising investment and sales growth with the Scatter Plot Excel Template from Besttemplates.com. Ideal for marketers, analysts, and small business owners, this template provides a straightforward way to analyze the impact of advertising spend on monthly sales. With an automated scatter plot, you can easily identify trends and make data-driven adjustments to your marketing strategies.
Key Features:
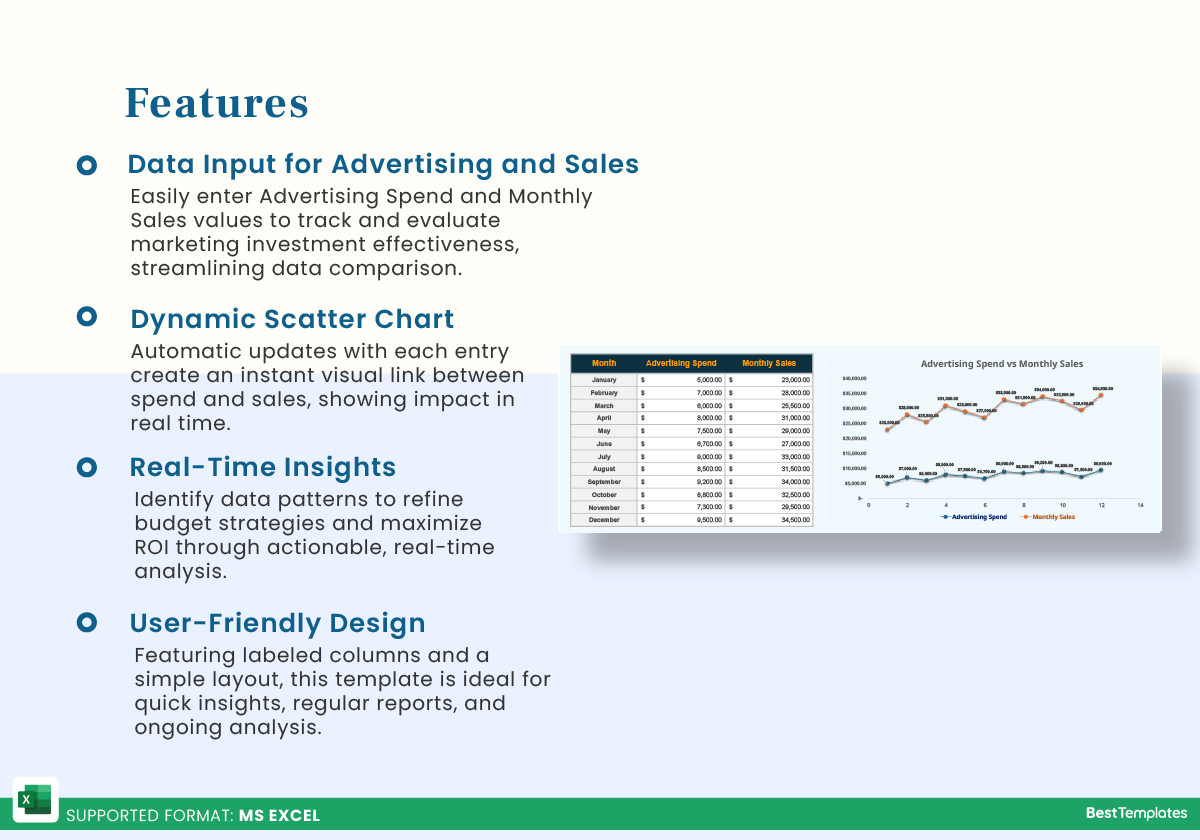
- Data Input for Advertising and Sales – Manually enter values for Advertising Spend and Monthly Sales to track and analyze marketing effectiveness.
- Dynamic Scatter Chart – The scatter plot automatically updates with each data entry, allowing for an instant visual representation of the correlation between spend and sales.
- Real-Time Insights – Identify patterns and trends in your data, helping you make informed decisions about optimizing your marketing budget.
- User-Friendly Design – With clearly labeled columns and an intuitive interface, this template requires minimal setup, making it perfect for quick insights and regular reporting.
Additional Information
| Available Formats | MS Excel |
|---|---|
| Sub Category | Charts |
Additional Product Info
- Compatibility: Excel 2013, 2016, 2019, 2021, Office 365
- Functionality: No VBA Macros or custom scripts needed
- Orientation Options: Portrait/Landscape
- Color Mode: RGB Color Space
- License Type: Standard License
- Customization: Easily editable and customizable
- Font Style: Business standard fonts are used
- Digital Optimization: Optimized for digital use only
- Printing Suitability: Suitable for printing


 No products in the cart.