Sales Analysis Excel Template
$9.00
Available in stock
Already have an account? Login
Add to cart| Available Formats | MS Excel |
|---|
Description
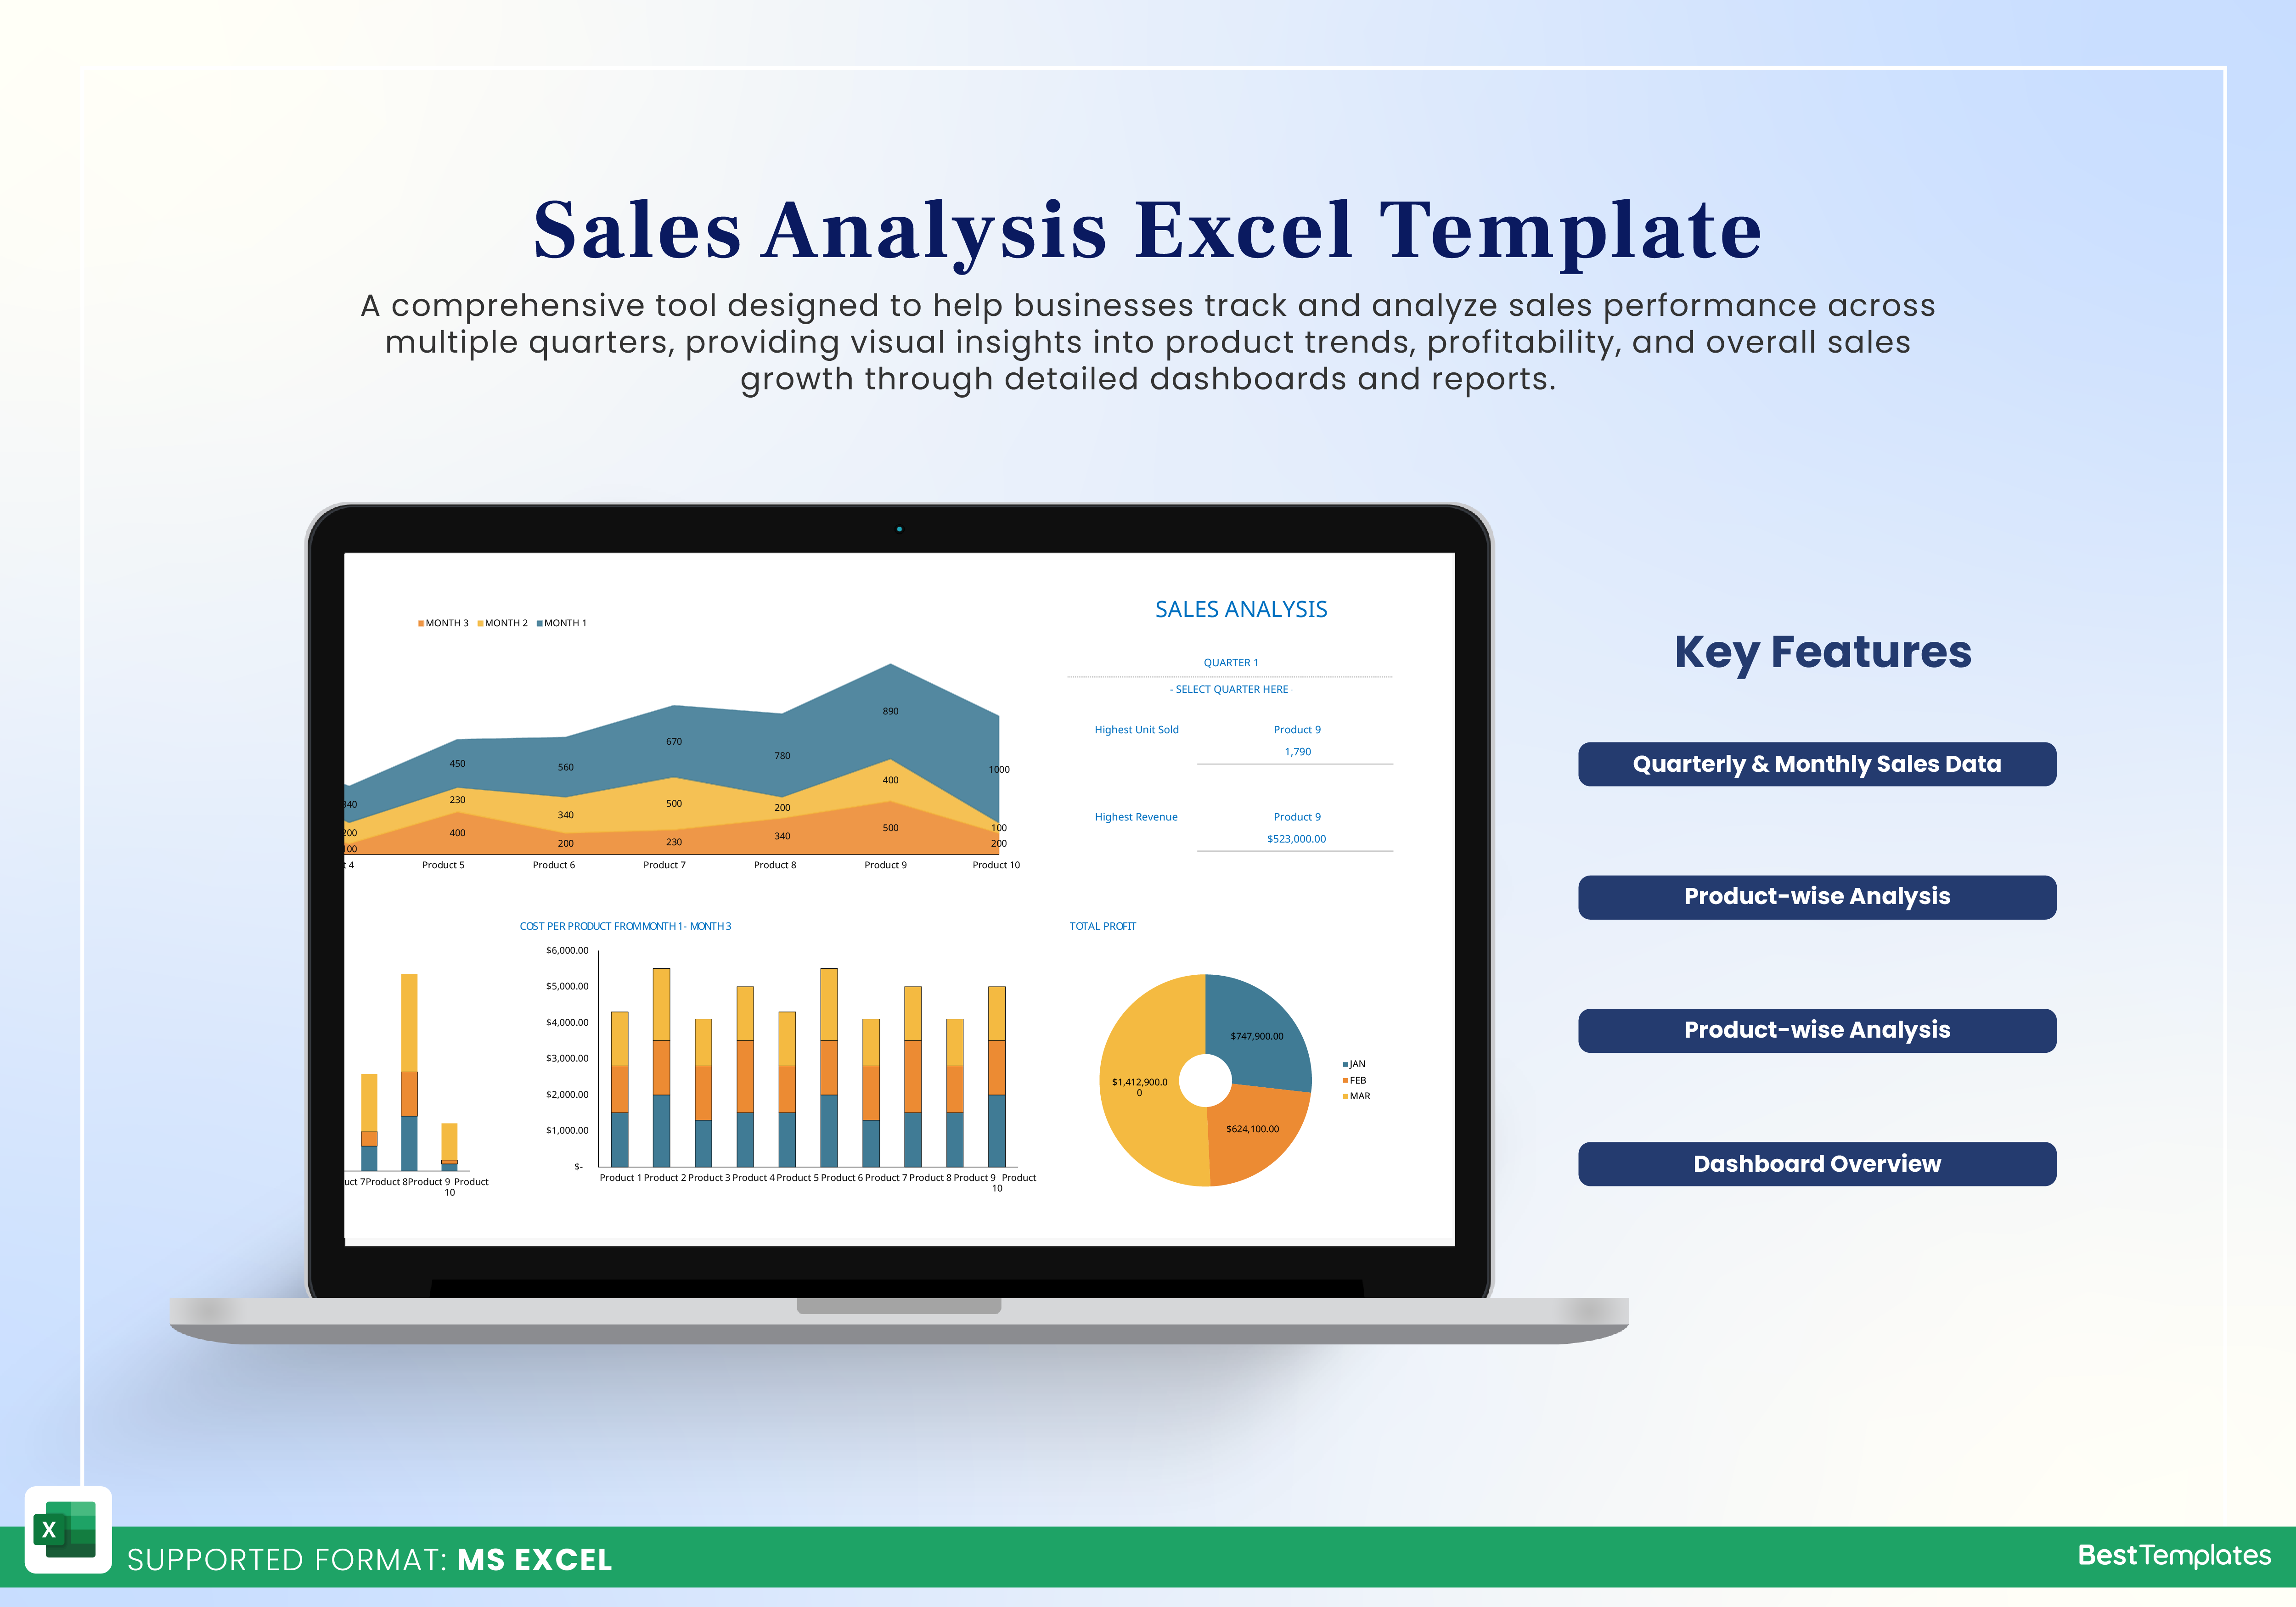
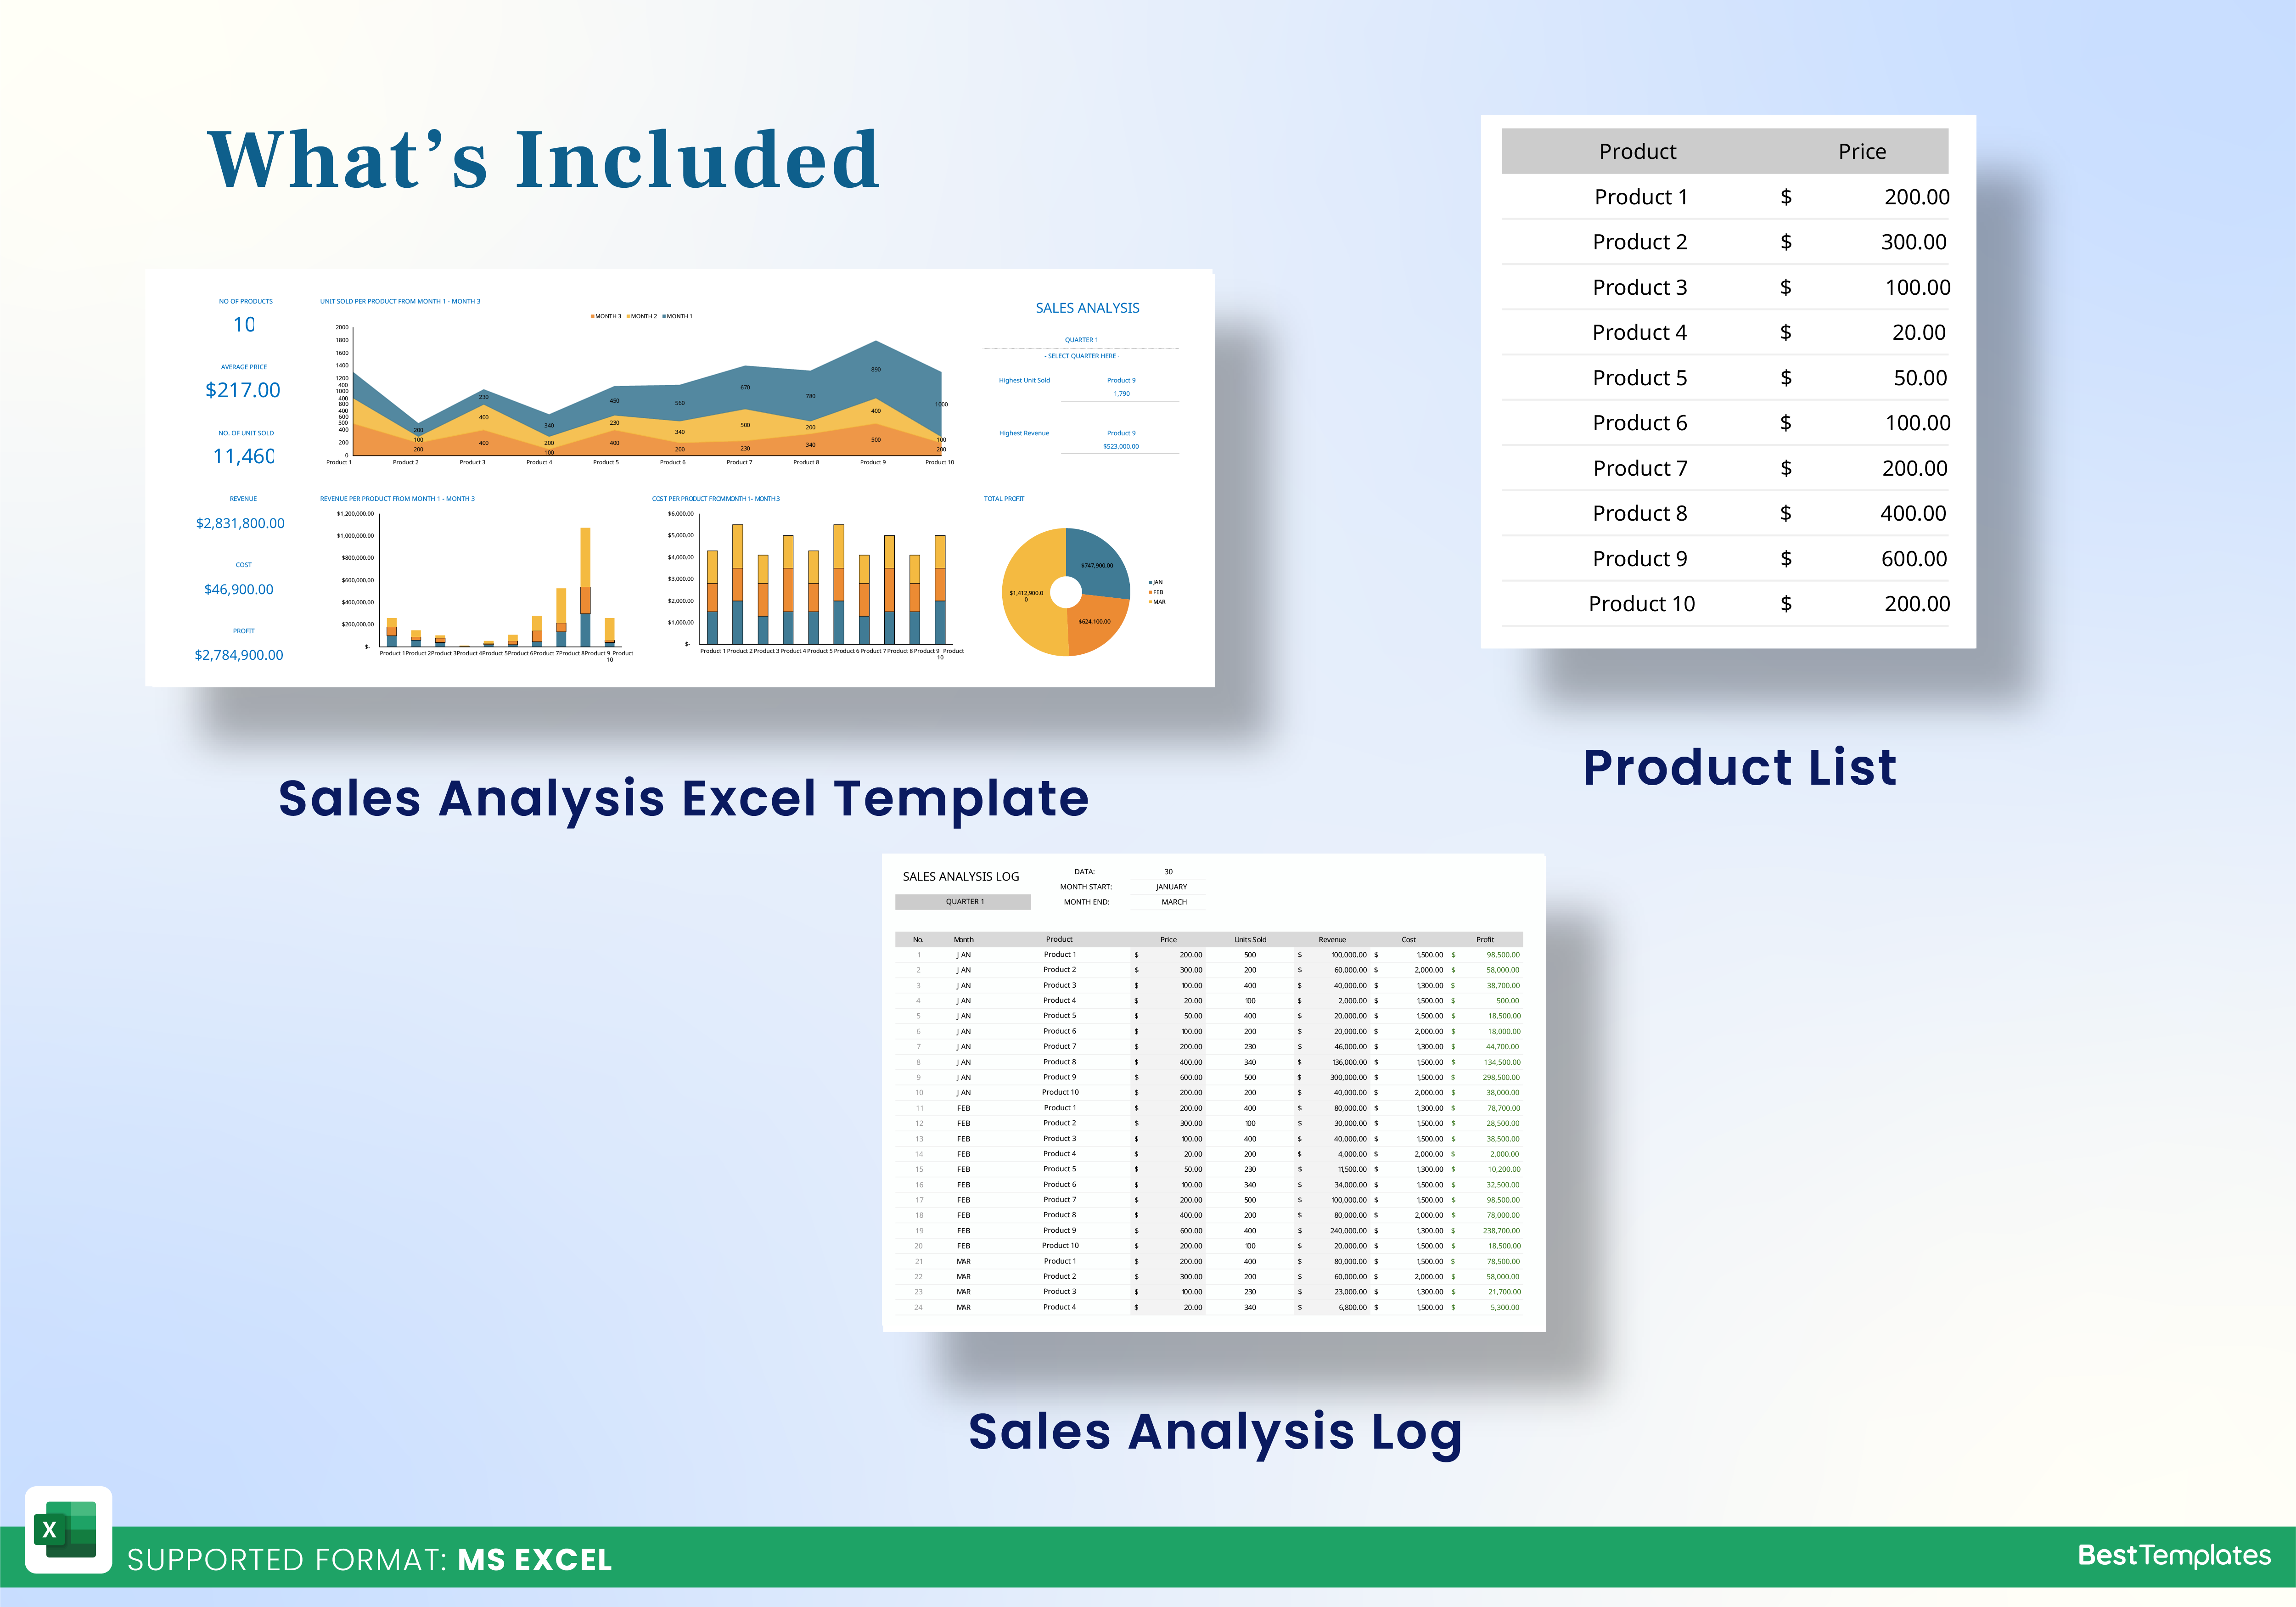
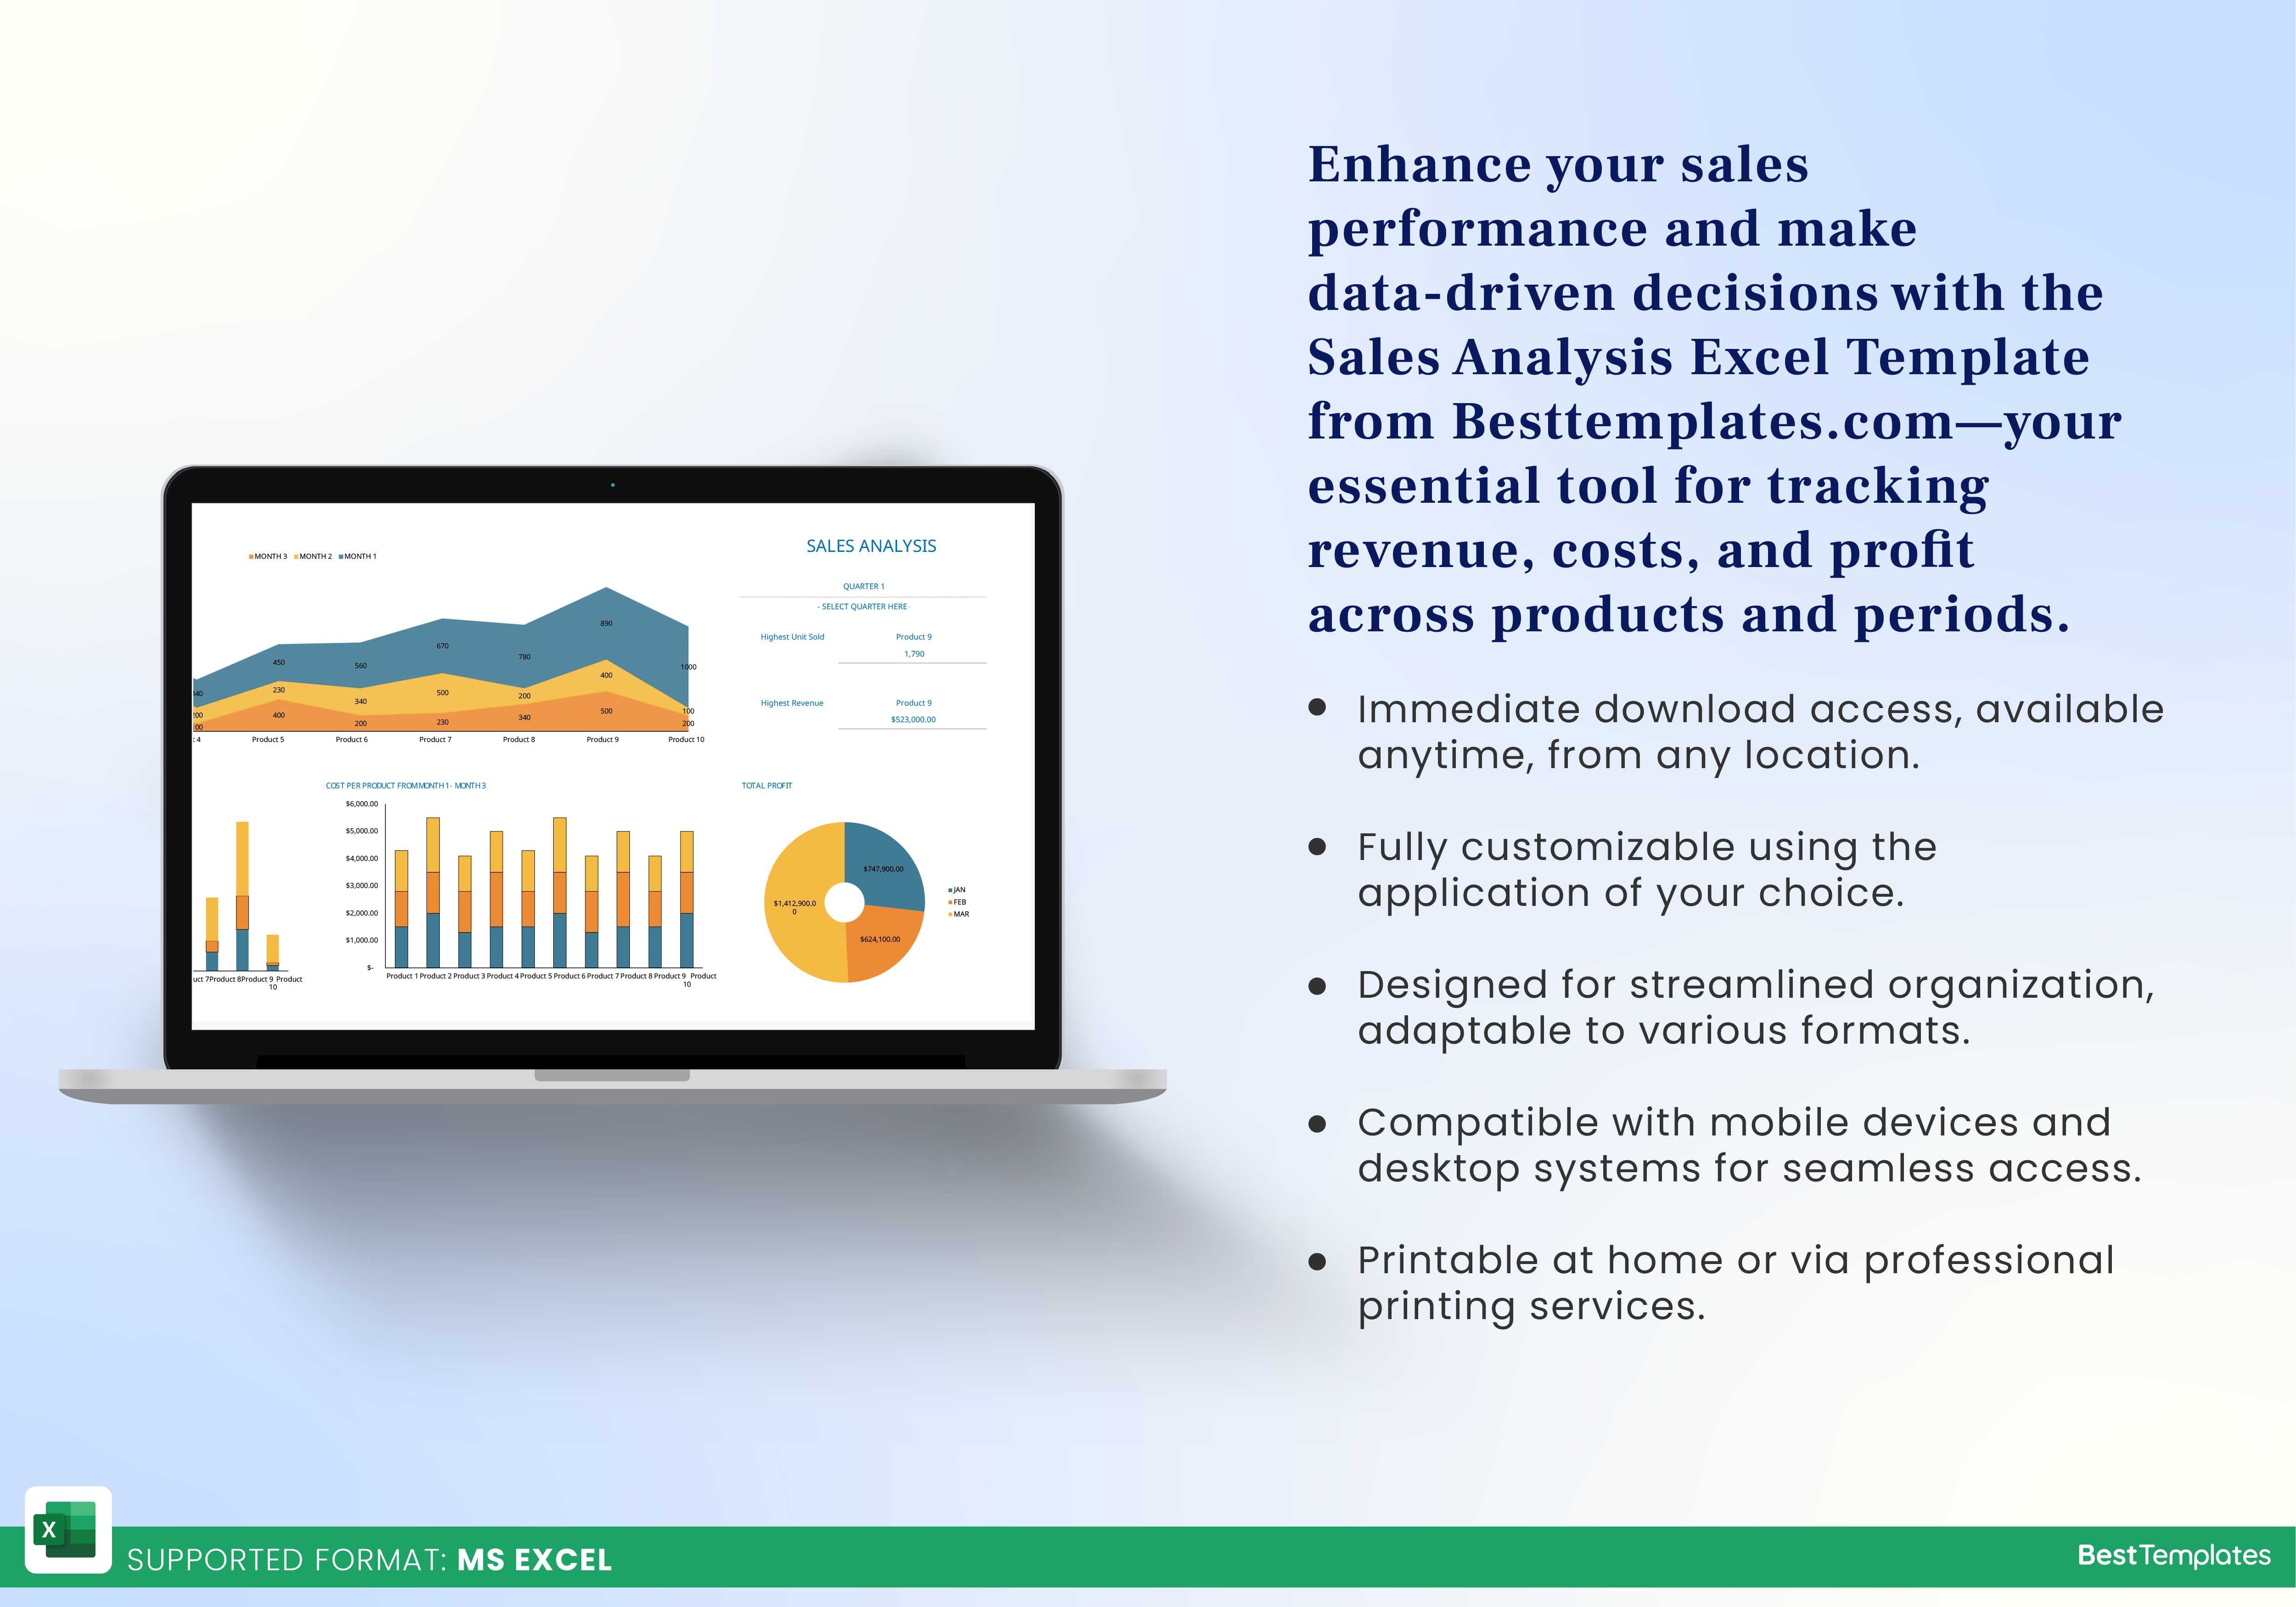
he Sales Analysis Excel Template from Besttemplates.com offers a comprehensive solution for businesses to track and analyze their sales performance across multiple quarters. This powerful tool includes a variety of dashboards, tables, and visual representations to assist users in better understanding their sales trends, product performance, and profitability.
Key features include:
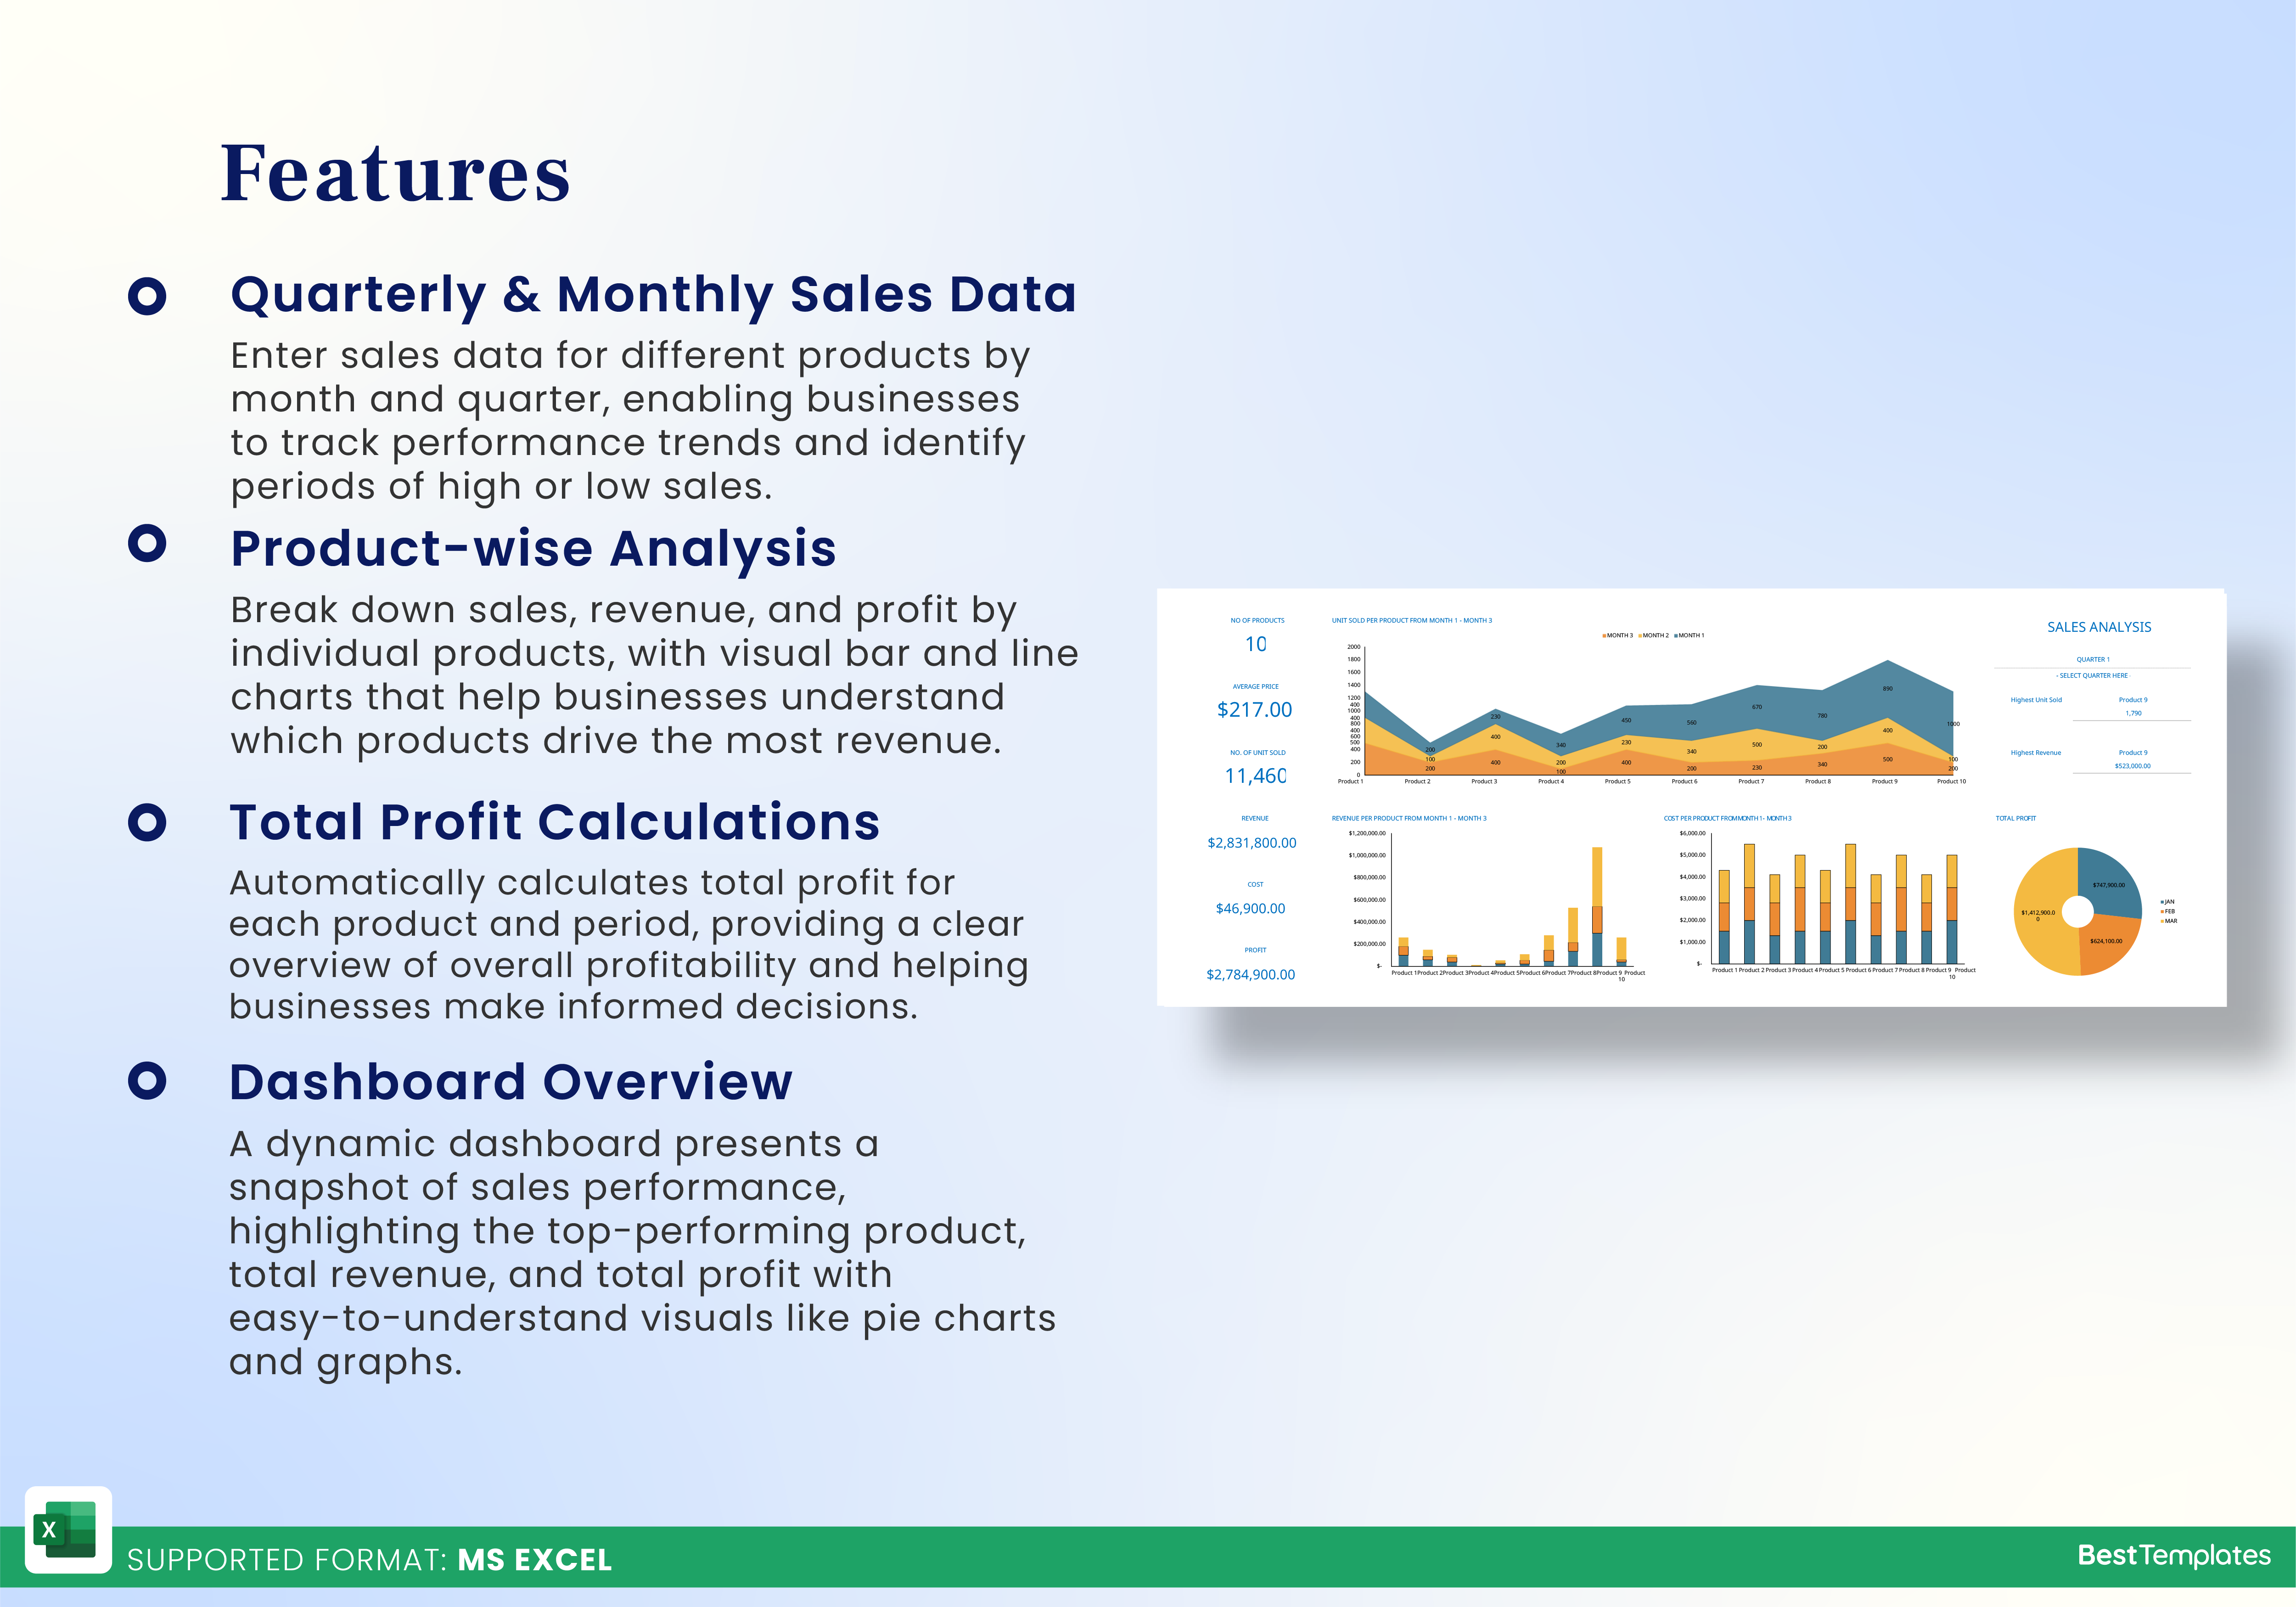
- Quarterly and Monthly Sales Data: The template allows users to enter sales data for different products, categorizing them by month and quarter. This structure helps businesses pinpoint specific periods with higher sales performance or underperforming times.
- Product-wise Analysis: A breakdown of sales, revenue, and profit by product allows businesses to see which items contribute the most to the bottom line. Graphs such as bar charts and line charts visually display units sold, revenue generated, and costs associated with each product.
- Total Profit Calculations: The template calculates the total profit for each product and period, giving users a clear snapshot of the business’s overall profitability.
- Customizable Tabs: With separate tabs for each quarter, businesses can easily switch between timeframes, making it simpler to perform detailed analysis for any specific period.
- Dashboard Overview: The dashboard provides a bird’s-eye view of the sales performance, highlighting the highest-performing product, total revenue, and total profit with user-friendly visuals like pie charts and graphs.
- Ease of Use: With intuitive data entry fields and clear visualizations, even non-experts can leverage the tool to make data-driven decisions.
Perfect for small businesses, sales managers, and financial analysts, the Sales Analysis Excel Template from Besttemplates.com ensures that critical data is organized and easily accessible. The clean layout and in-depth analysis features help in making informed decisions, streamlining reporting, and enhancing overall business performance.
Additional Information
| Available Formats | MS Excel |
|---|
Additional Product Info
- Compatibility: Excel 2021, Office 365
- Functionality: No VBA Macros or custom scripts needed
- Orientation Options: Portrait/Landscape
- Color Mode: RGB Color Space
- License Type: Standard License
- Customization: Easily editable and customizable
- Font Style: Business standard fonts are used
- Digital Optimization: Optimized for digital use only
- Printing Suitability: Suitable for printing


 No products in the cart.