Pie Chart Excel Template
$9.00
Available in stock
Already have an account? Login
Add to cart| Available Formats | MS Excel |
|---|
Description
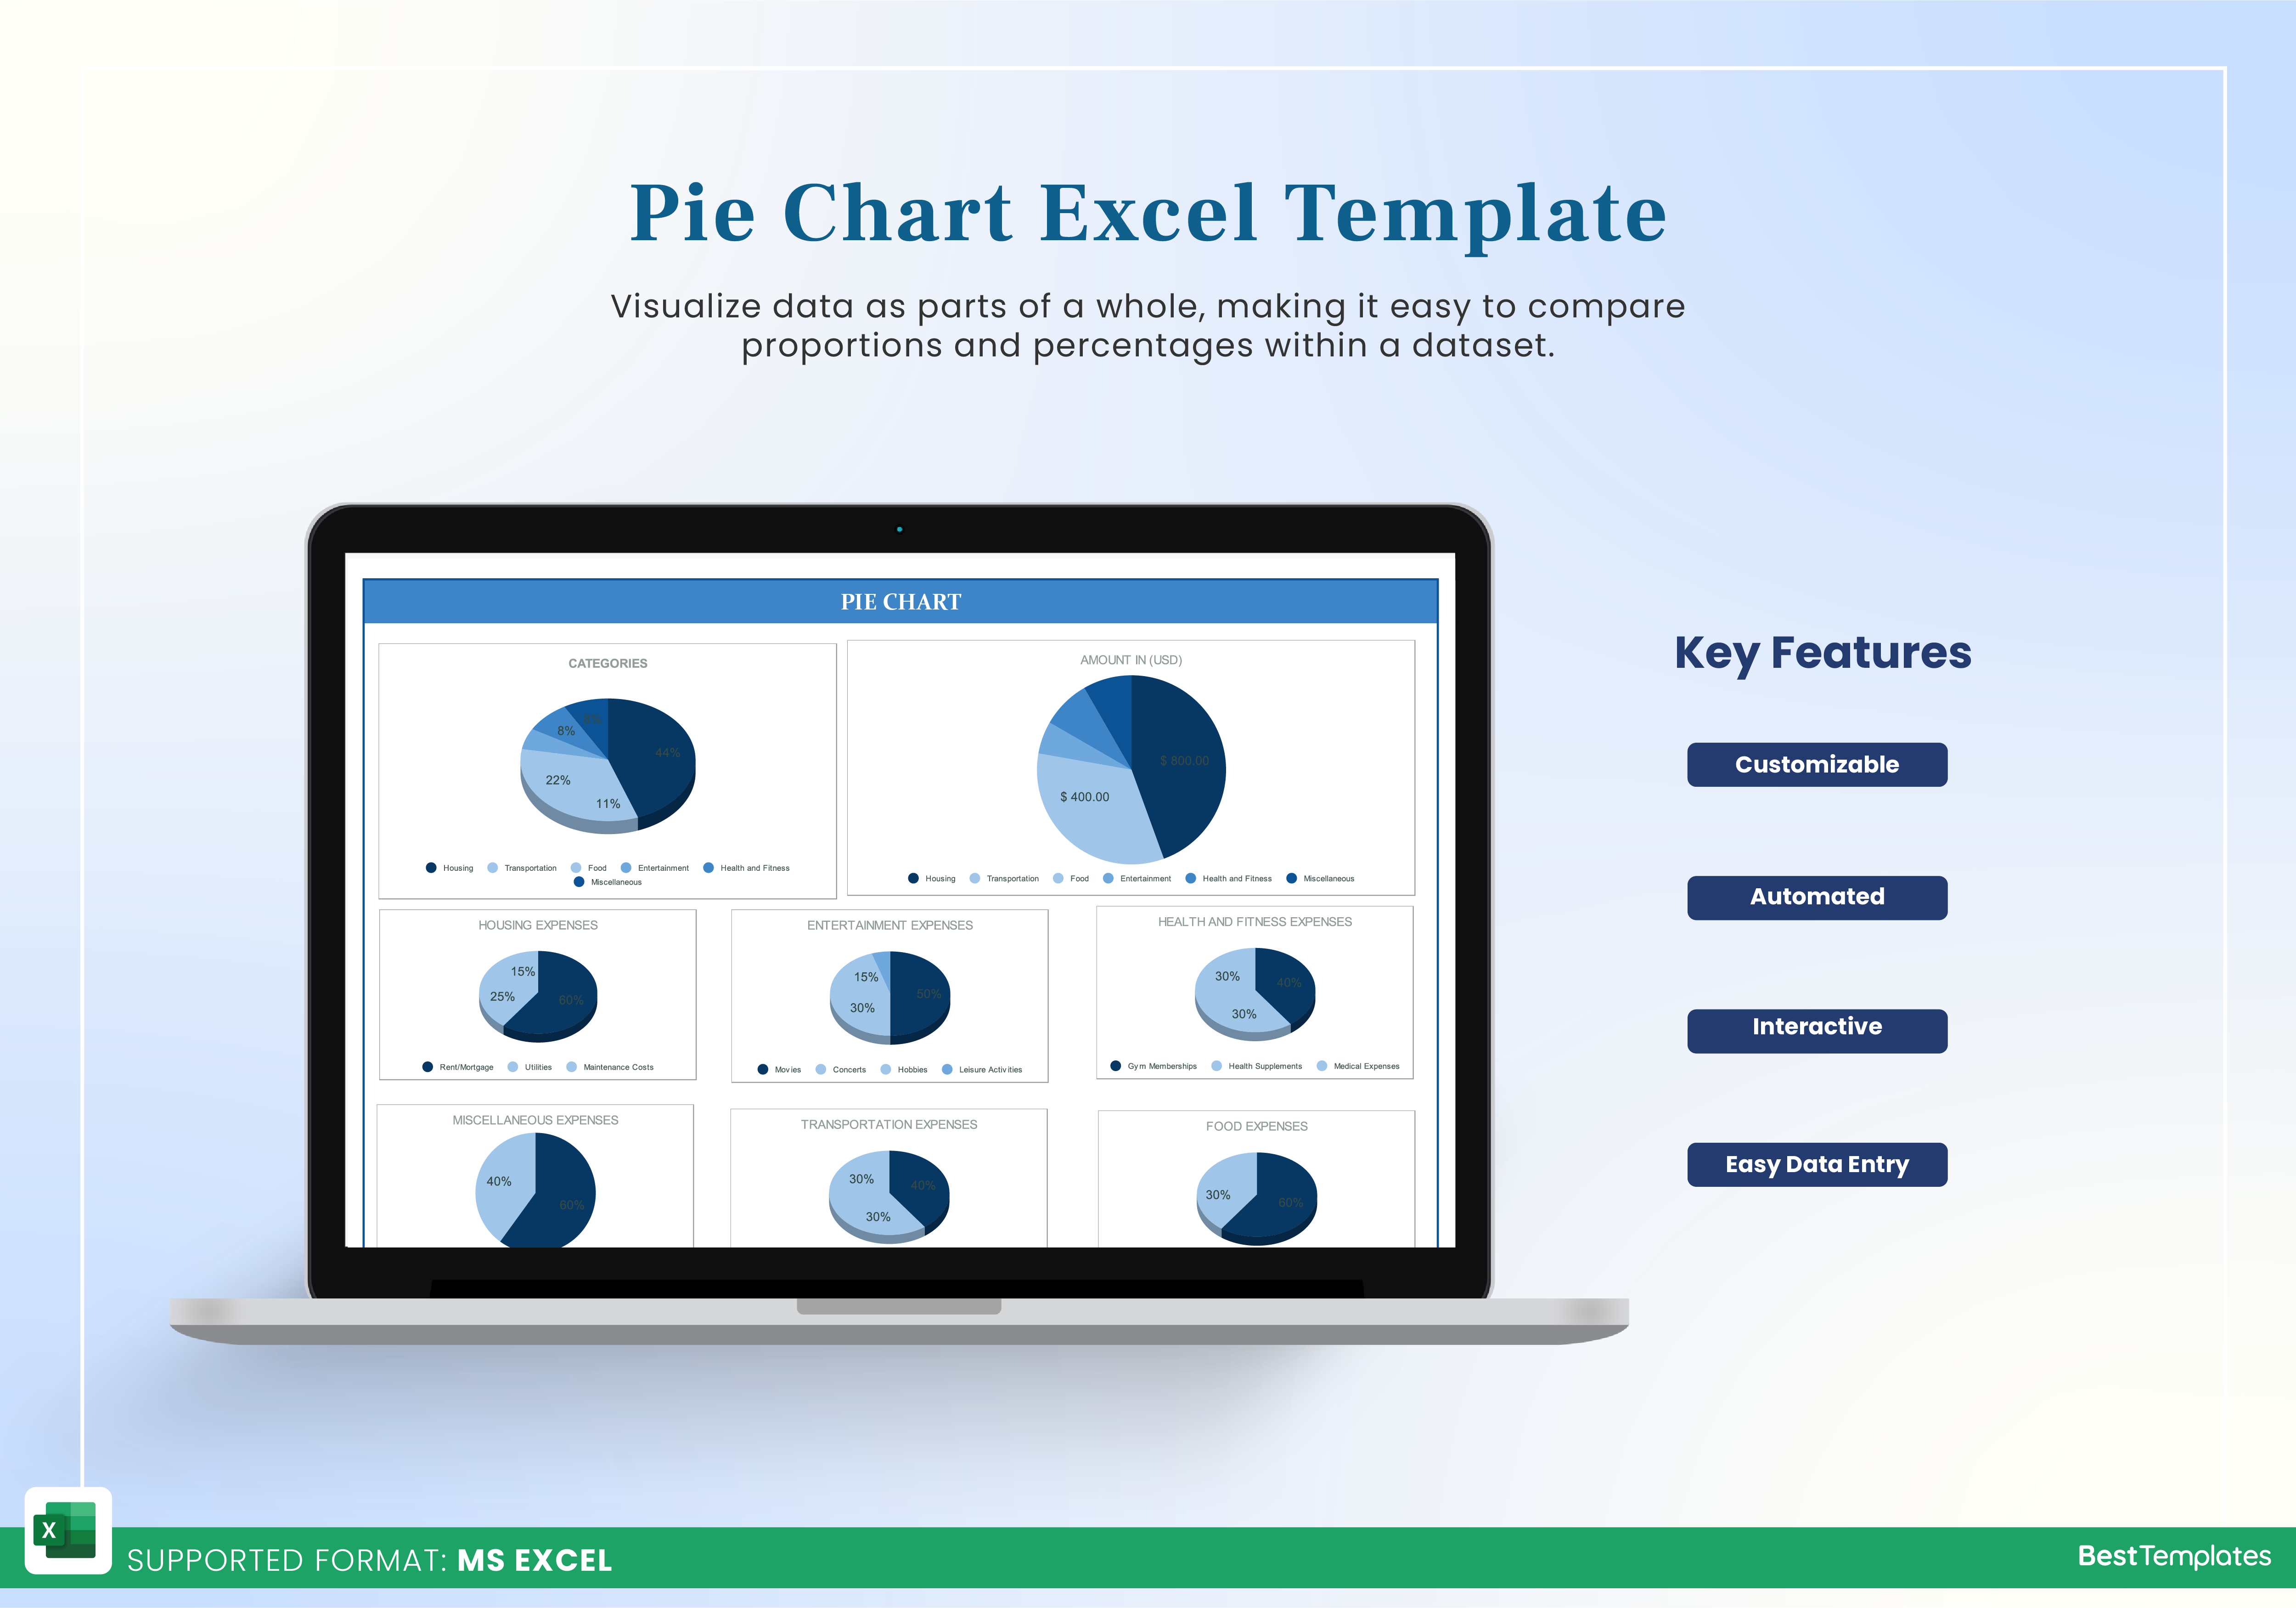
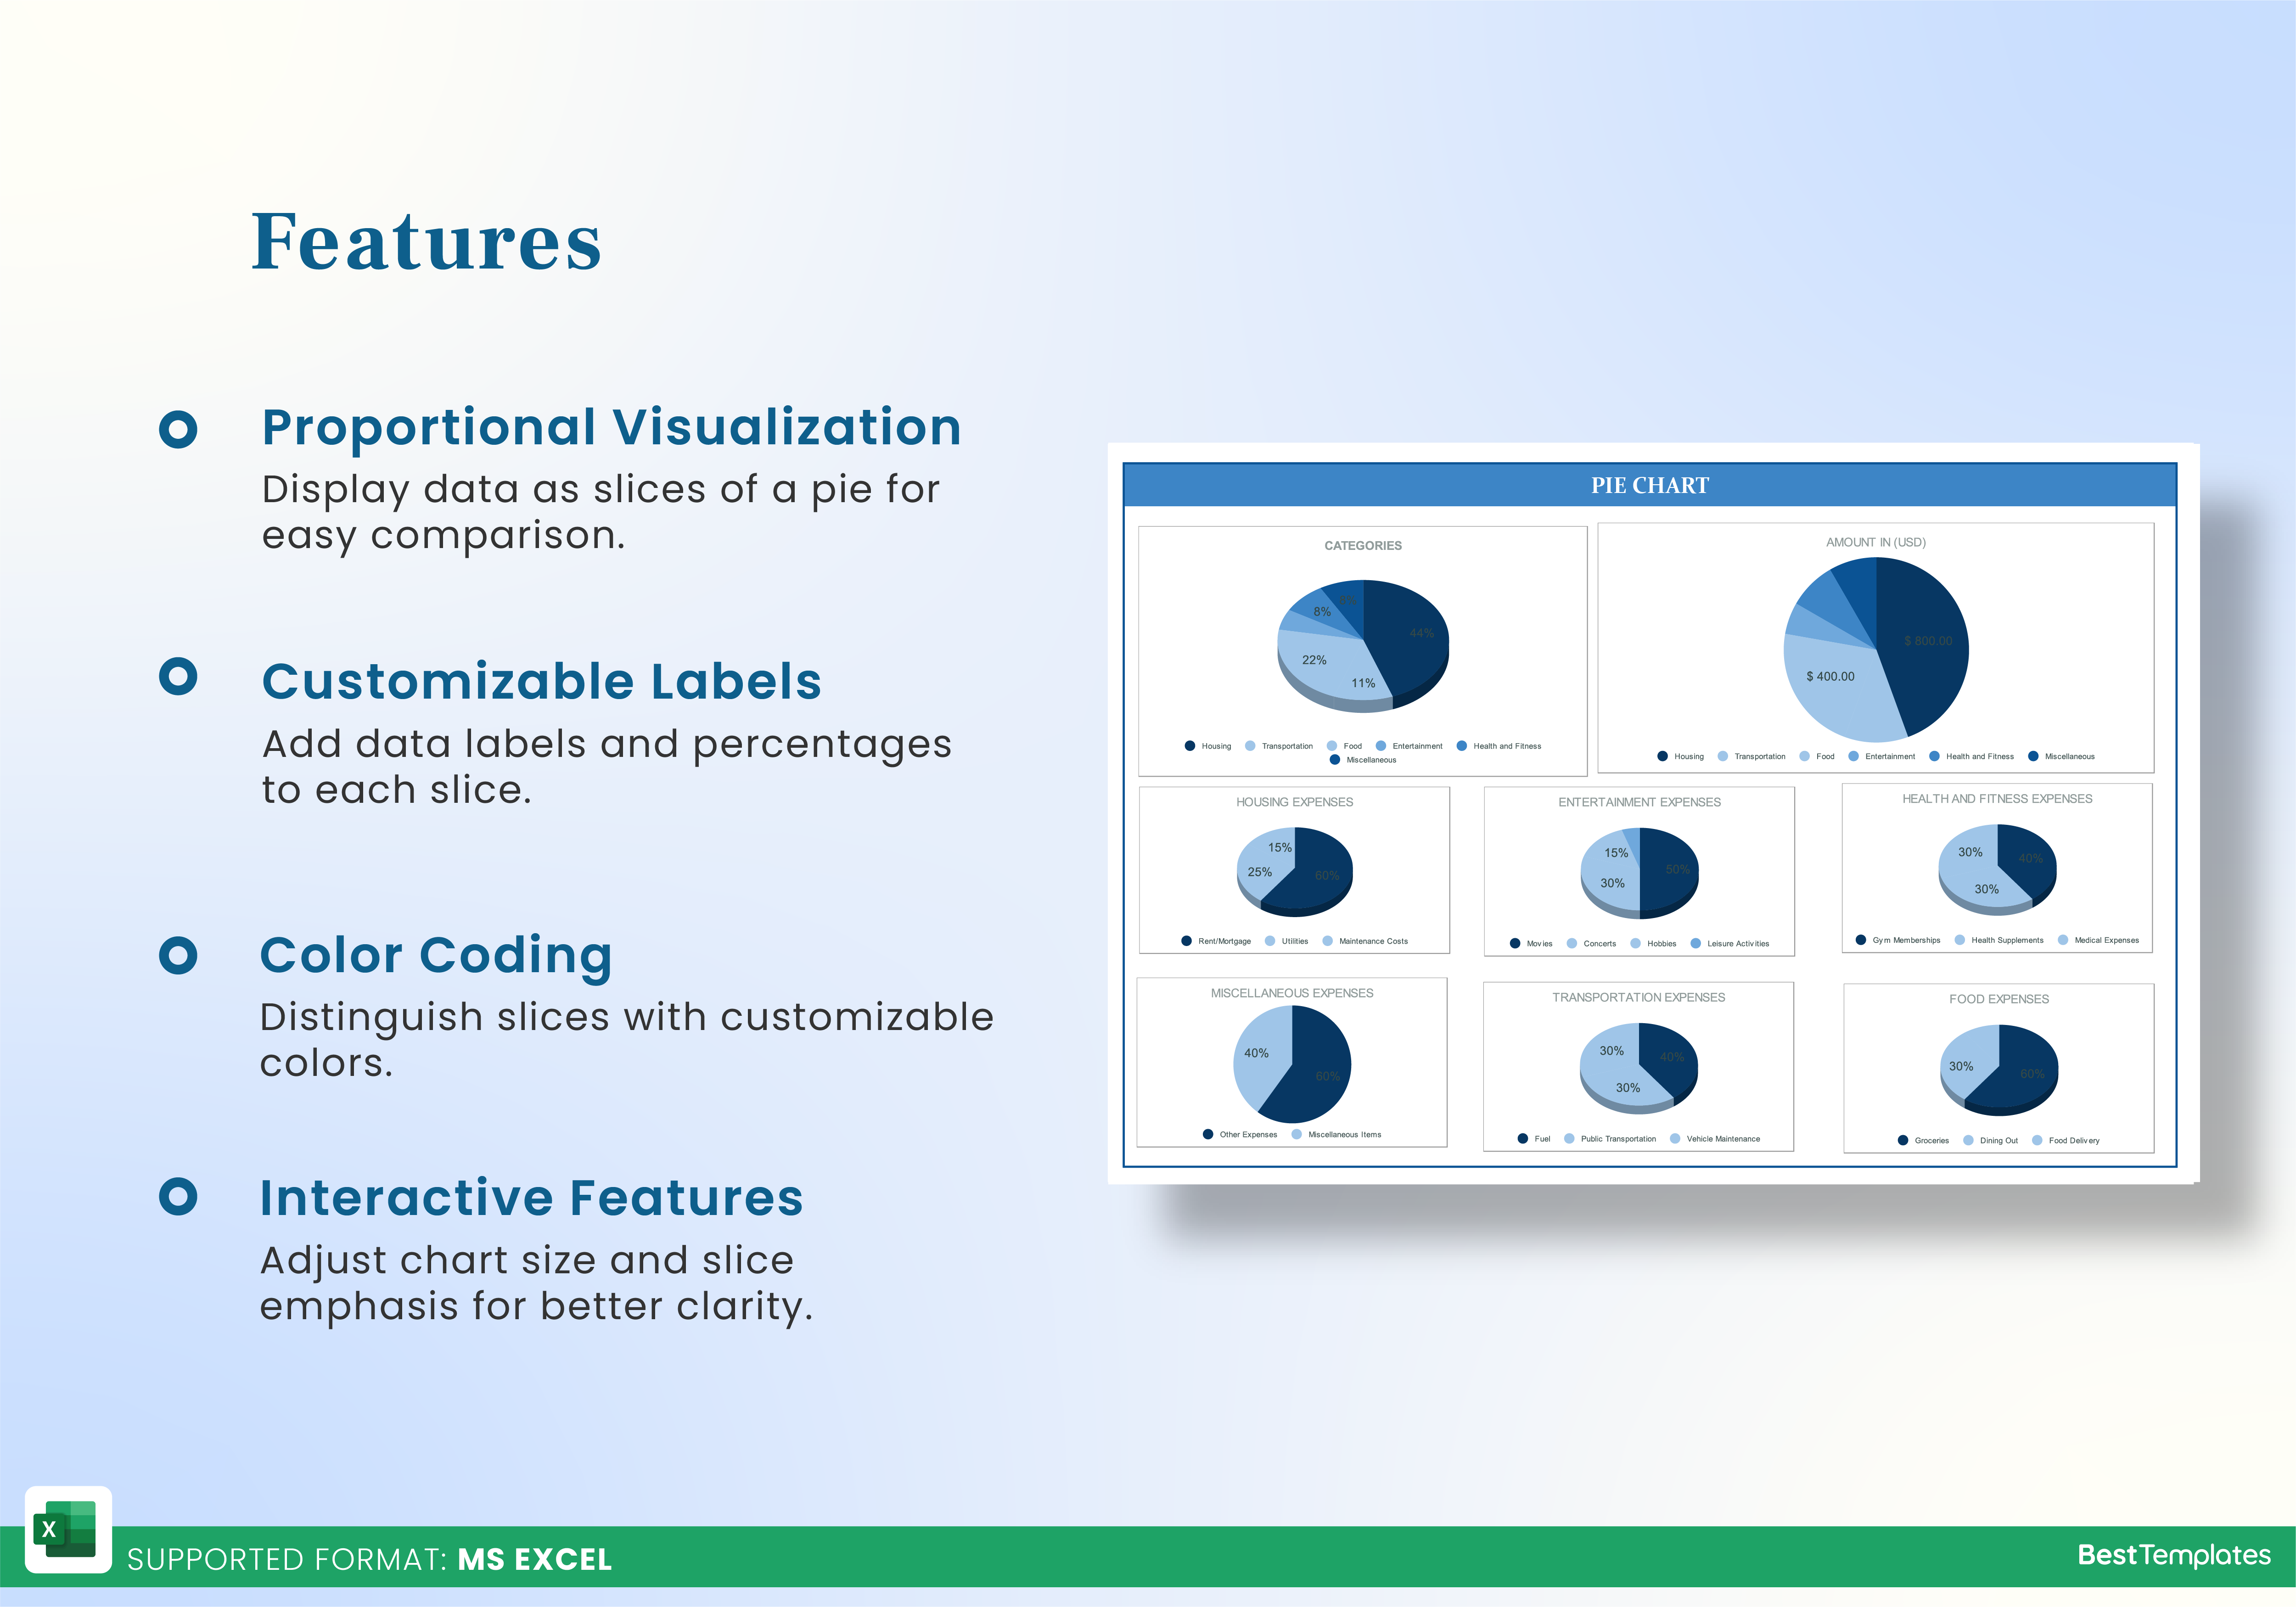
Looking for a streamlined way to visualize your expenses in Excel? Besttemplates.com offers an intuitive Pie Chart Excel Template, ideal for anyone wanting to break down their finances with ease. This template allows you to input amounts for various categories, including Housing Expenses, Transportation, Food Expenses, Entertainment, Health & Fitness, and Miscellaneous. Simply enter the data in the “Data” sheet, and the percentage column will automatically calculate based on your input. No need to manually compute; it’s all done for you!
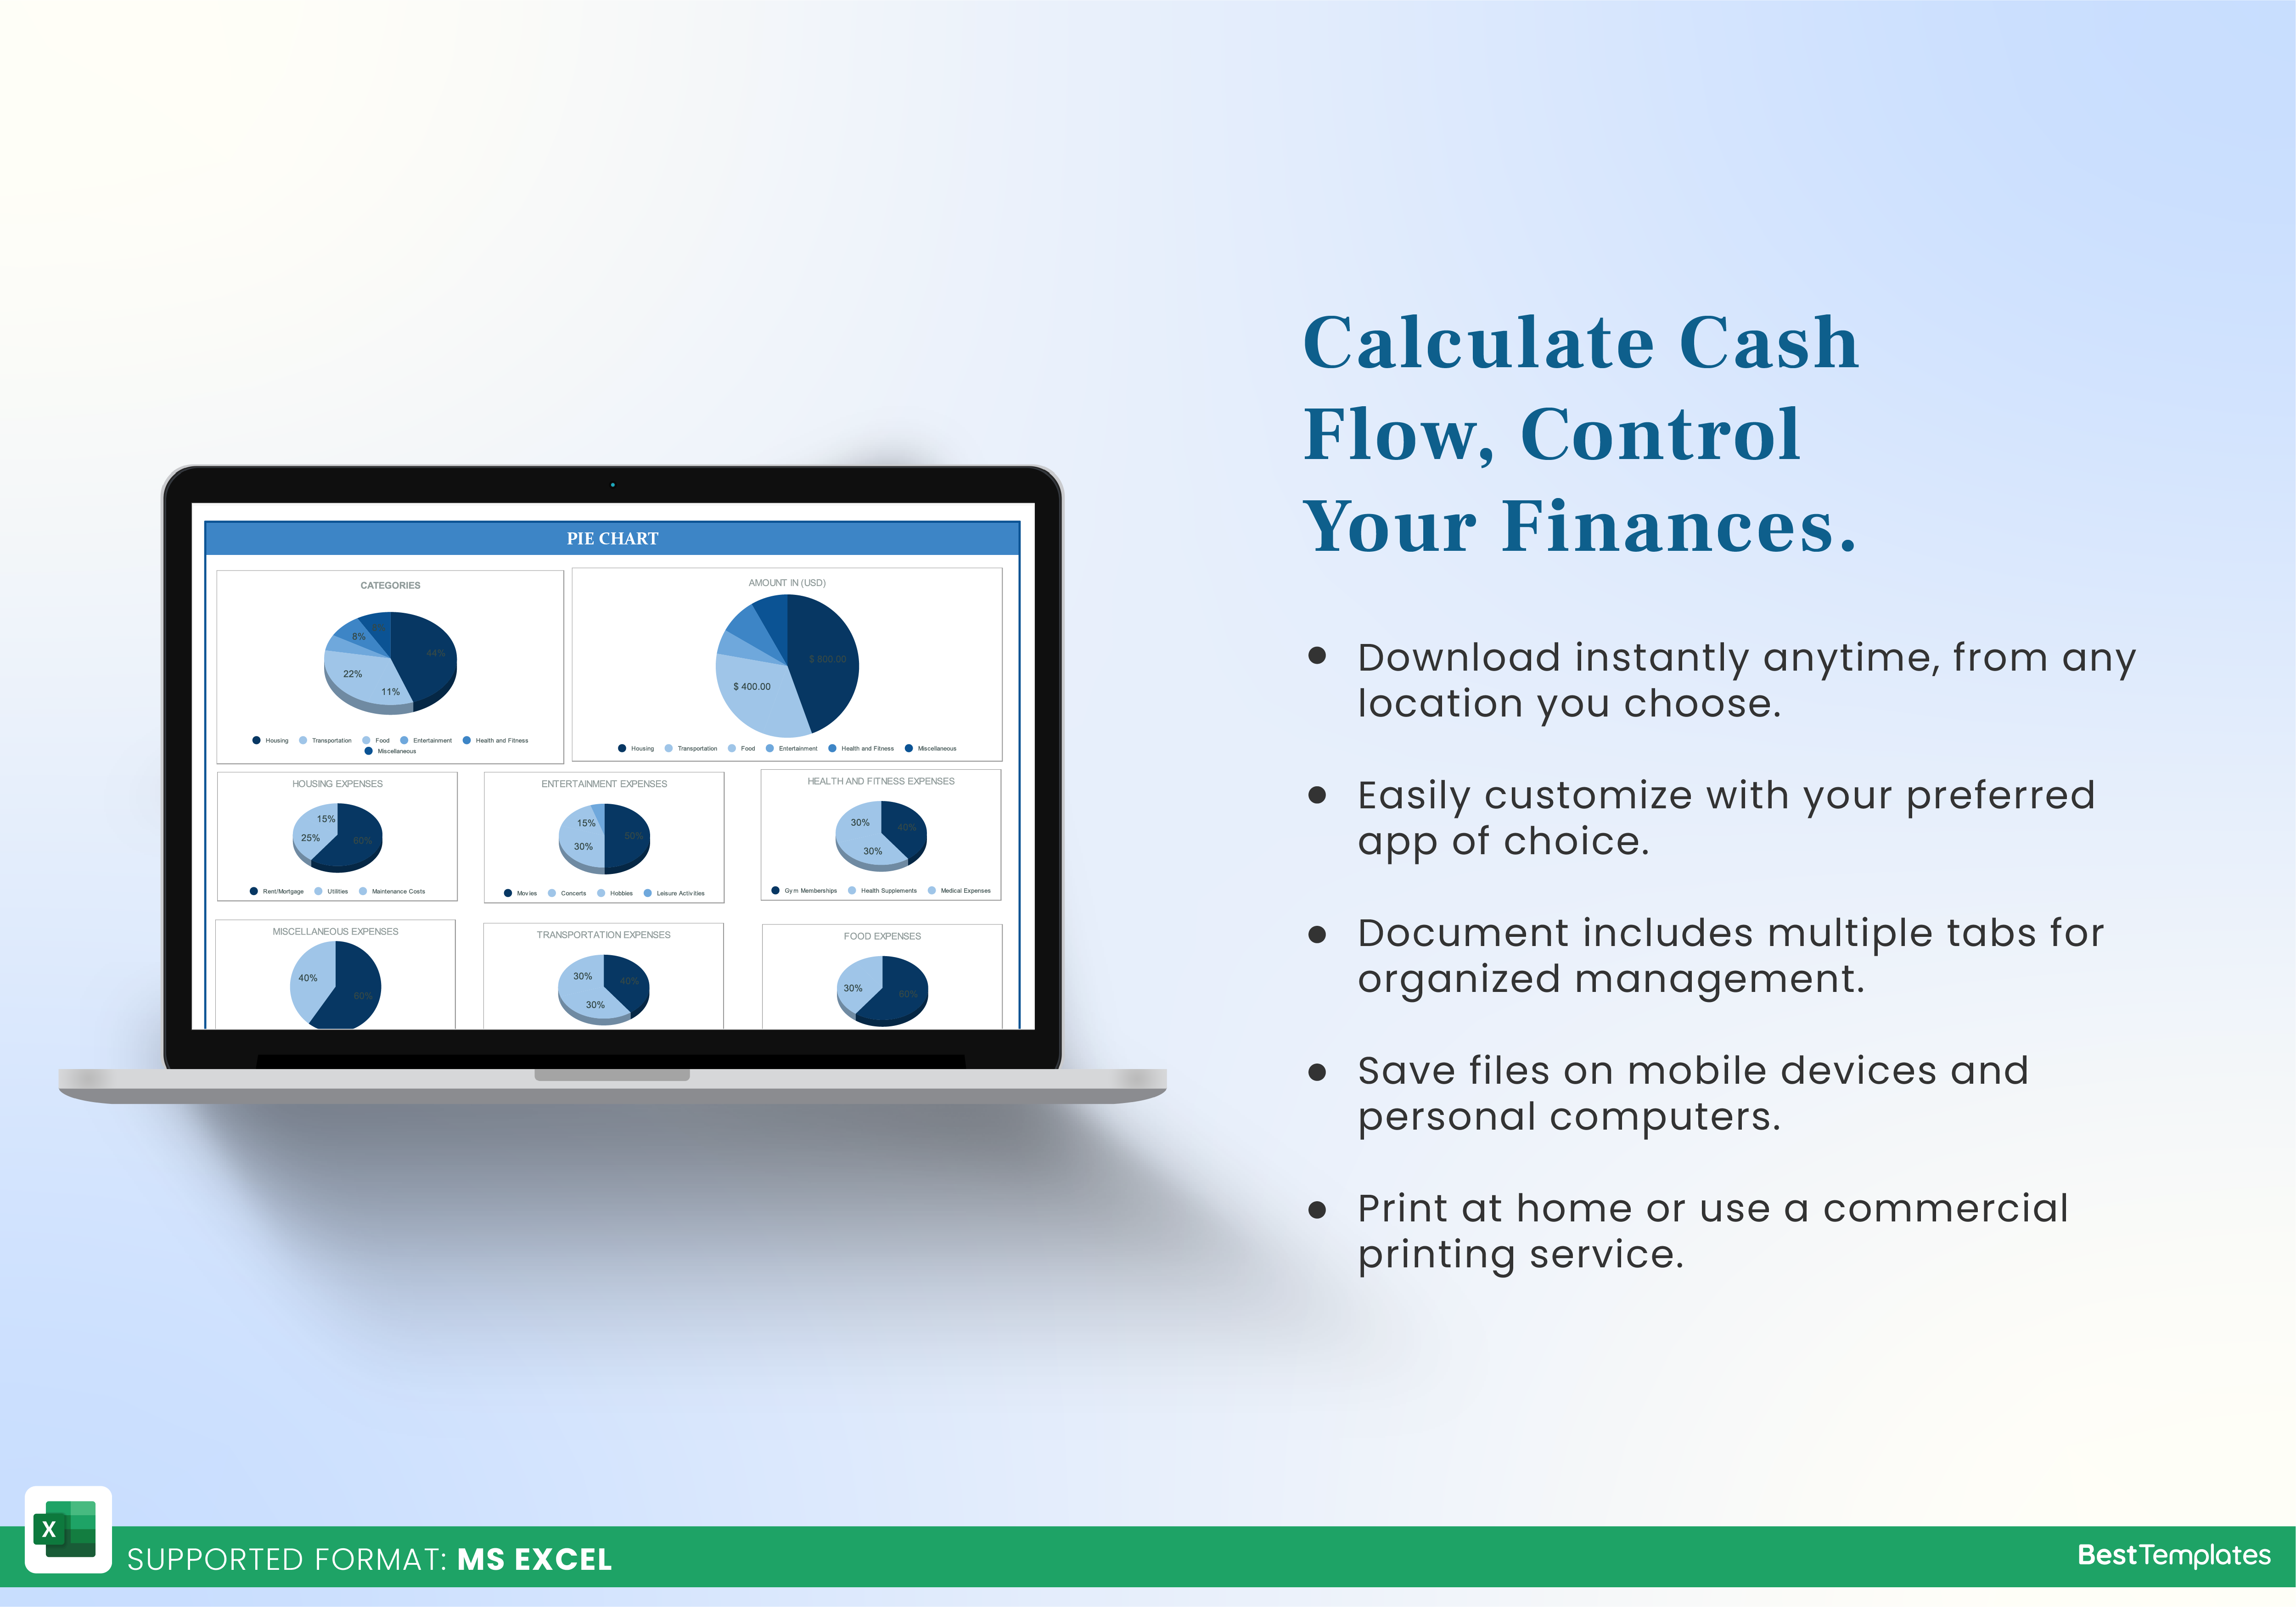
The “Pie Chart” sheet then pulls data from the “Data” sheet, visually displaying your expenses in a clean and organized chart. This allows for an instant overview of how each category contributes to your overall spending. Perfect for personal budgeting, business expense tracking, or any other financial analysis, this template provides a simple yet powerful tool for your data visualization needs.
Key Features:
- Pre-formulated percentage column for ease of use
- Multiple expense categories for more detailed tracking
- Automatically updated pie chart based on your input
- Clear data organization for effortless expense visualization
With Besttemplates.com, creating financial reports and making sense of your expenses has never been easier. Whether for personal or professional use, this template gives you everything you need for a thorough visual breakdown of your spending.
Additional Information
| Available Formats | MS Excel |
|---|
Additional Product Info
- Compatibility: Excel 2013, 2016, 2019, 2021, Office 365
- Functionality: No VBA Macros or custom scripts needed
- Orientation Options: Portrait/Landscape
- Color Mode: RGB Color Space
- License Type: Standard License
- Customization: Easily editable and customizable
- Font Style: Business standard fonts are used
- Digital Optimization: Optimized for digital use only
- Printing Suitability: Suitable for printing


 No products in the cart.