Performance Dashboard Excel Template
$19.99
Available in stock
Already have an account? Login
Add to cart| Available Formats | MS Excel |
|---|
Description
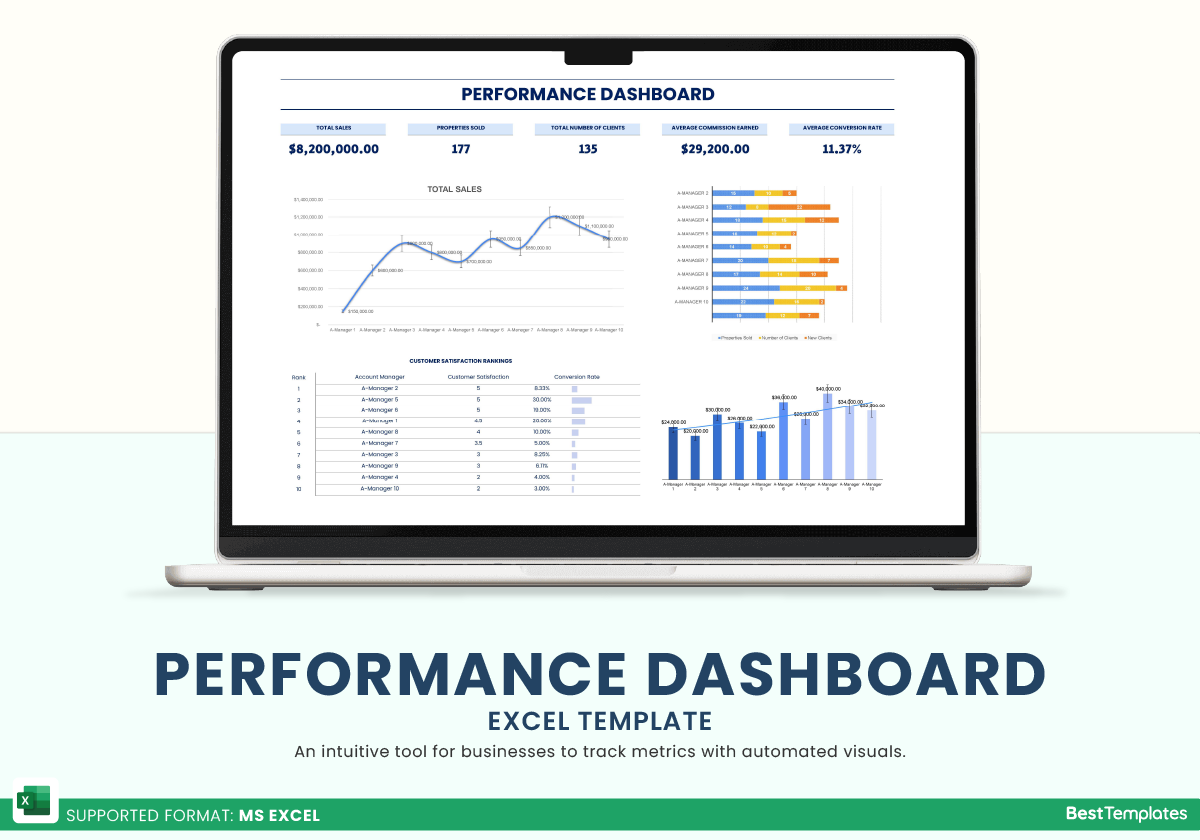
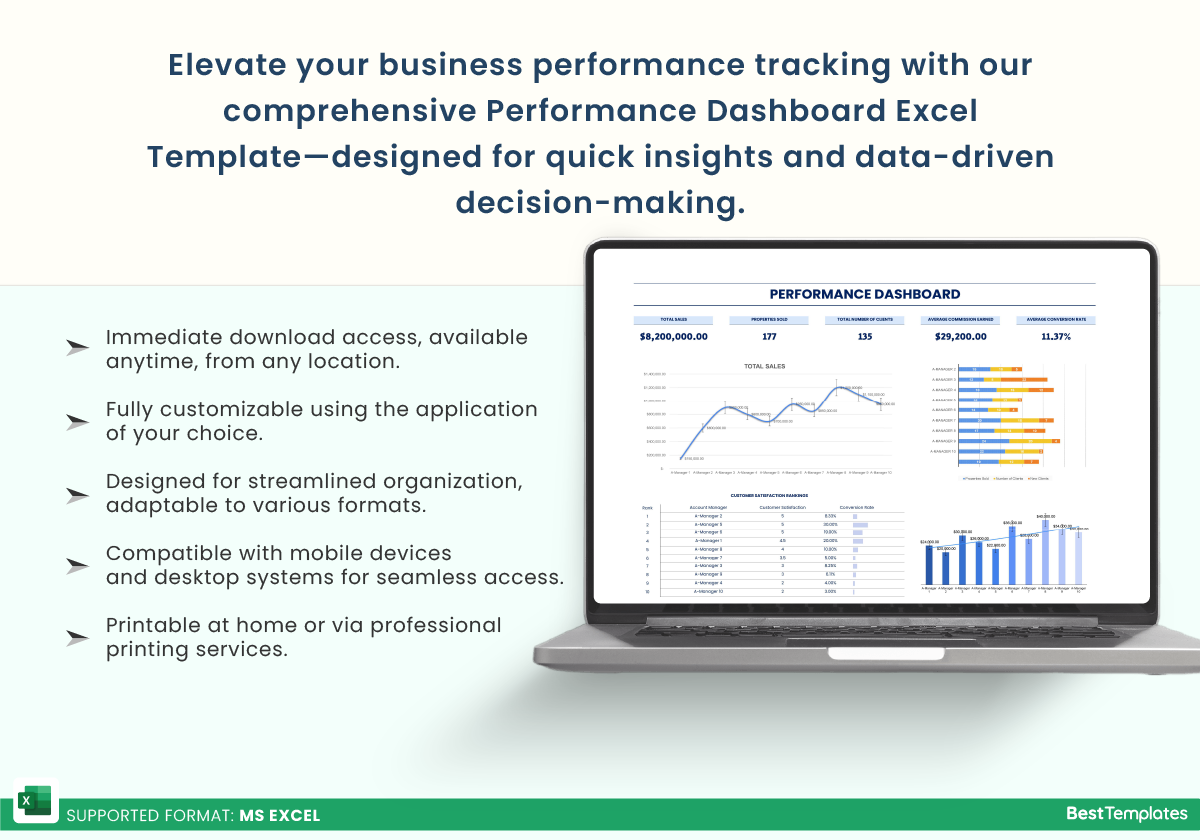
The Performance Dashboard Excel Template from Besttemplates.com is a robust and intuitive tool designed to help businesses monitor and visualize their performance metrics with ease. This template is perfect for managers, team leads, and analysts who want to track key performance indicators (KPIs) efficiently. With its user-friendly interface, simply input your data into the “Data” sheet, and watch as the “Dashboard” sheet instantly transforms this data into visually appealing charts and summaries. The template automatically calculates the conversion rate, while total and average figures are clearly displayed above, giving you at-a-glance insights. Additionally, it includes a customer satisfaction ranking feature to help measure overall performance.
Key Features
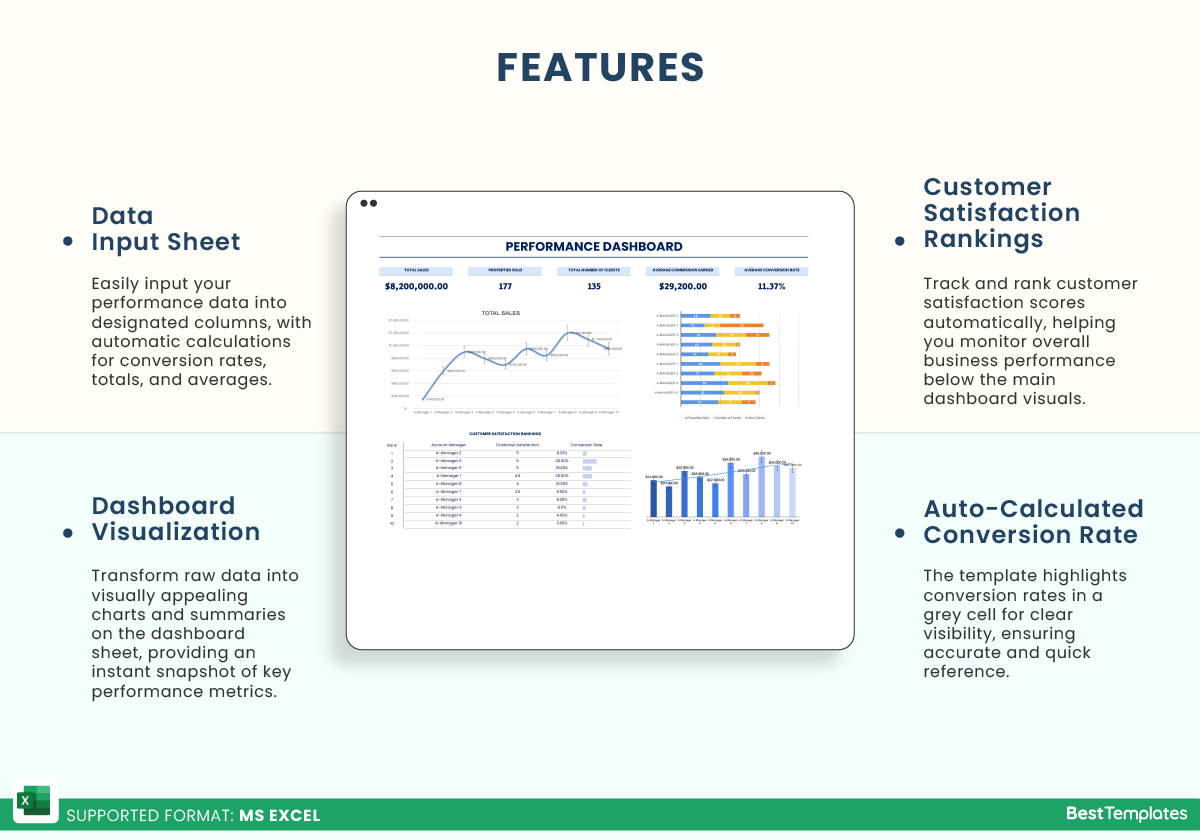
- Data Input Sheet: Input data into the columns, with auto-formulated conversion rates.
- Dashboard Visualization: Displays totals and averages, with charts for detailed analysis.
- Customer Satisfaction Rankings: Automatically ranked below the charts.
- Auto-Calculated Conversion Rate: Highlighted in grey for clear distinction.
- Real-Time Analysis: Instant updates as data is entered, providing real-time feedback.
- Professional Design: Sleek, easy-to-read interface for users of all levels.
The Performance Dashboard Excel Template ensures that tracking your KPIs and overall performance is seamless and highly visual. It’s a must-have tool for businesses that need a clear and comprehensive view of their data to make informed decisions quickly. Make your performance monitoring more efficient with Besttemplates.com.
Additional Information
| Available Formats | MS Excel |
|---|
Additional Product Info
- Compatibility: Excel 2013, 2016, 2019, 2021, Office 365
- Functionality: No VBA Macros or custom scripts needed
- Orientation Options: Portrait/Landscape
- Color Mode: RGB Color Space
- License Type: Standard License
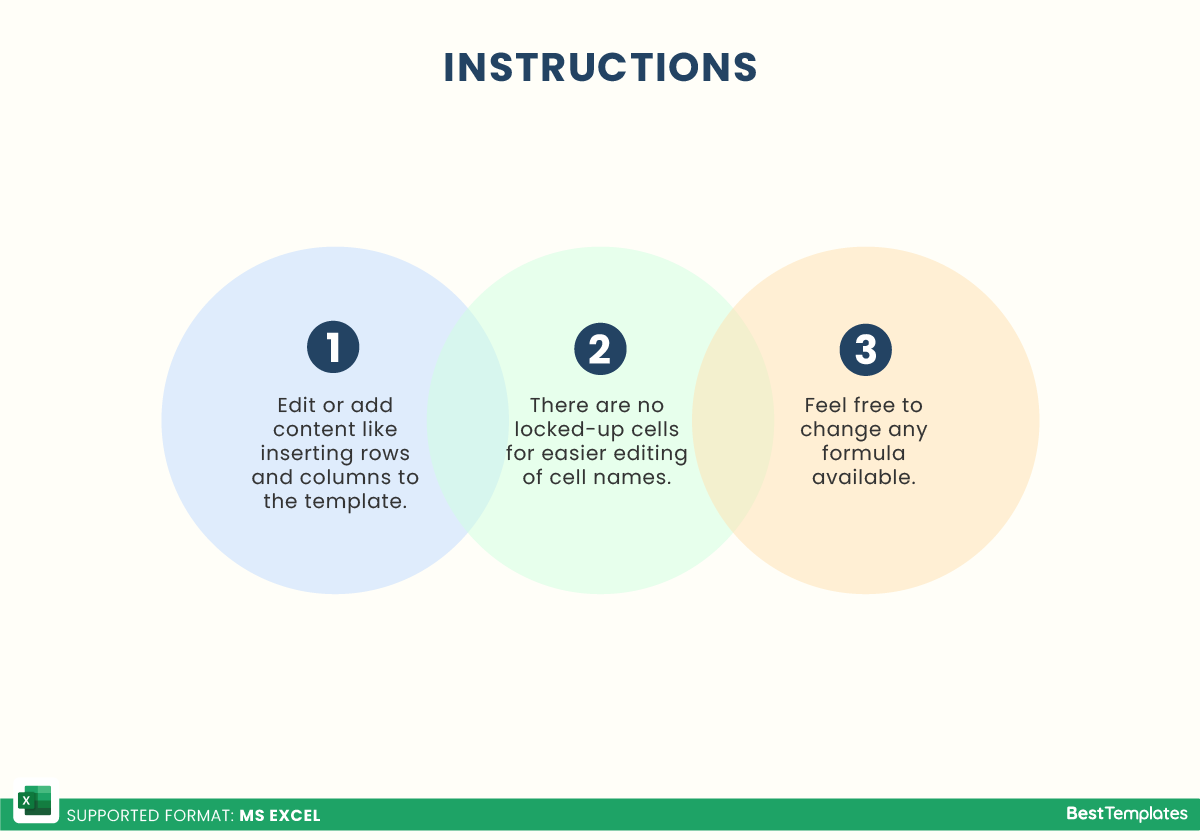
- Customization: Easily editable and customizable
- Font Style: Business standard fonts are used
- Digital Optimization: Optimized for digital use only
- Printing Suitability: Suitable for printing


 No products in the cart.