Pareto Chart Excel Template
$9.00
Available in stock
Already have an account? Login
Add to cart| Available Formats | MS Excel |
|---|
Description
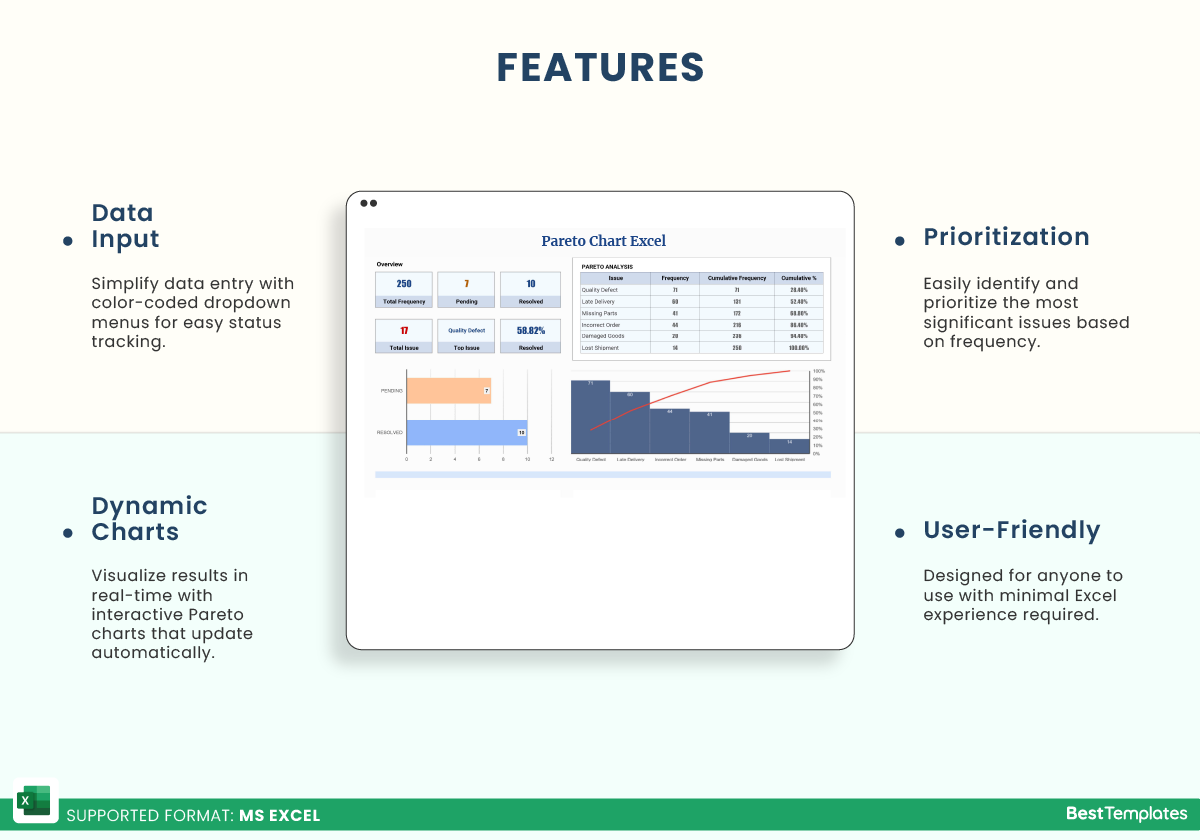
The Pareto Chart Excel Template available on Besttemplates.com is a comprehensive and user-friendly tool designed to help businesses and individuals efficiently perform Pareto analysis. Ideal for identifying and prioritizing the most significant issues in a dataset, this template enables better decision-making and resource allocation. Its intuitive structure simplifies the process of creating Pareto charts and conducting analysis. The template includes two key sheets: “Data Input” and “Pareto Chart Excel”. In the “Data Input” sheet, users can easily input data based on various parameters, such as the issue, frequency, and status. The status column features a convenient dropdown menu that is color-coded to indicate different levels of urgency or priority, allowing users to quickly visualize and organize their data. This color-coding adds an extra layer of clarity, highlighting important issues at a glance and making it easier to prioritize tasks.
Key Features:
- User-Friendly Interface: The template is designed for ease of use, requiring minimal Excel expertise.
- Data Input Sheet: Easily input data with predefined dropdowns for status and color-coded priority levels.
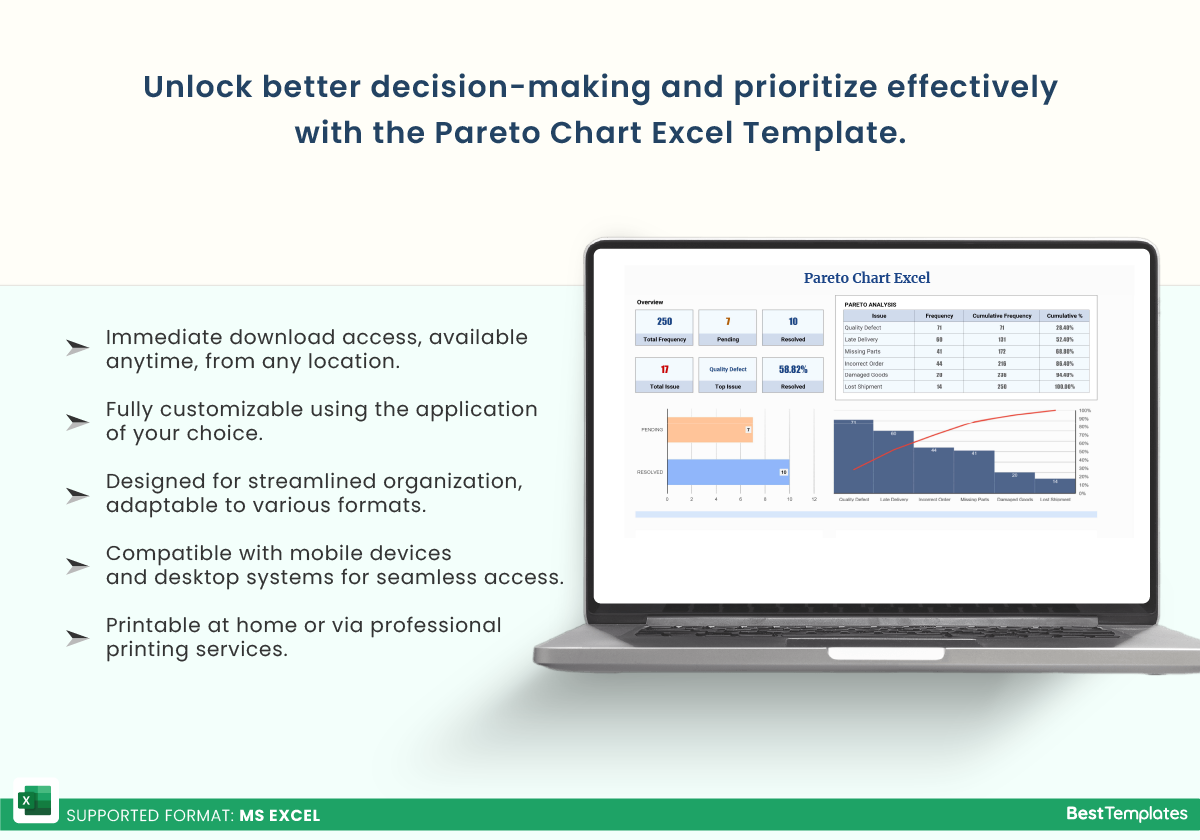
- Pareto Analysis Table: Automatically generates a Pareto analysis table, calculating cumulative frequency and percentage.
- Dynamic Charts: Visualizes results with dynamic Pareto charts that update automatically as new data is entered.
- Comprehensive Overview: Provides an overview of all issues, including status and frequency, for a complete understanding of your data.
- Efficient Prioritization: Helps you prioritize the most impactful issues based on frequency, allowing for better resource allocation.
The “Pareto Chart Excel” sheet not only provides the Pareto analysis table but also includes visual Pareto charts that make it easier to identify the most critical issues. The cumulative frequency and percentage data allow users to quickly identify which issues have the greatest impact, enabling them to focus on solving the most significant problems. Whether you’re managing product defects, customer complaints, or operational inefficiencies, this template helps streamline decision-making and improve workflows.
Additional Information
| Available Formats | MS Excel |
|---|
Additional Product Info
- Compatibility: Excel 2021, Office 365
- Functionality: No VBA Macros or custom scripts needed
- Orientation Options: Portrait/Landscape
- Color Mode: RGB Color Space
- License Type: Standard License
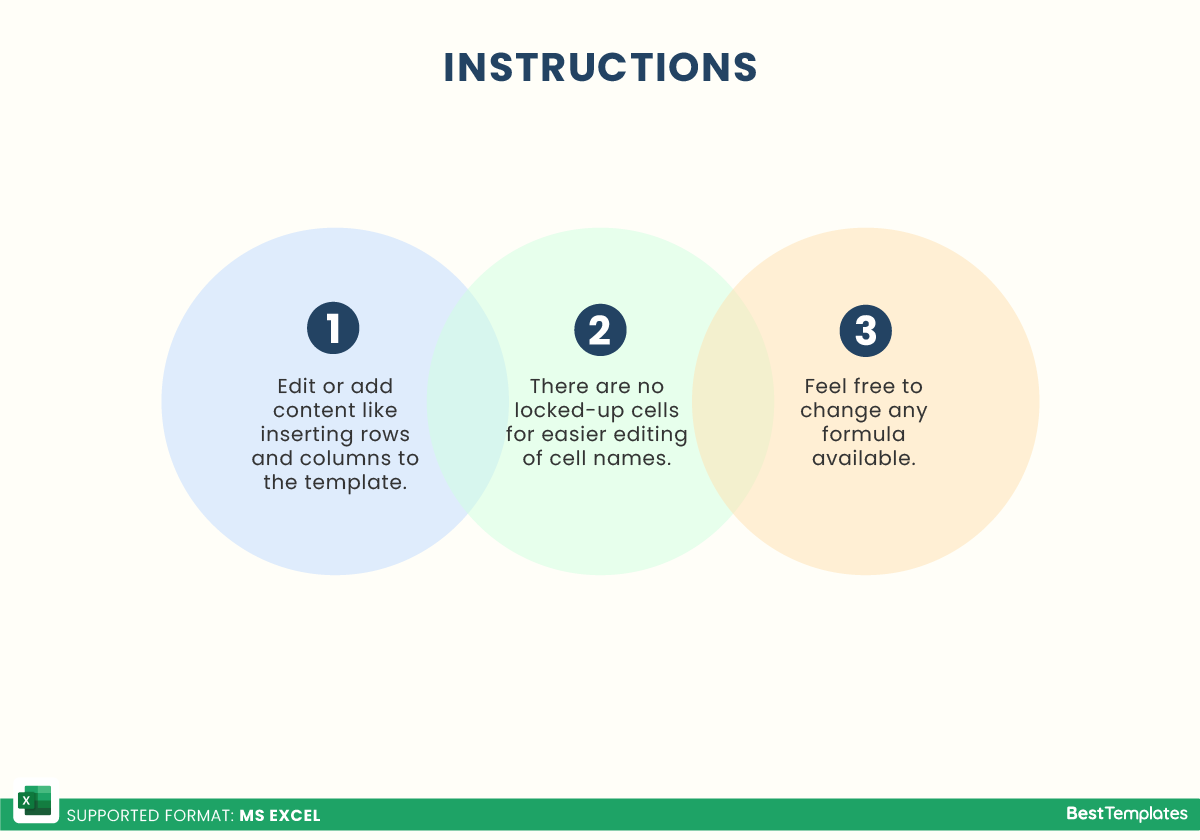
- Customization: Easily editable and customizable
- Font Style: Business standard fonts are used
- Digital Optimization: Optimized for digital use only
- Printing Suitability: Suitable for printing


 No products in the cart.