Line Chart Excel Template
$9.00
Available in stock
Already have an account? Login
Add to cart| Available Formats | MS Excel |
|---|
Description
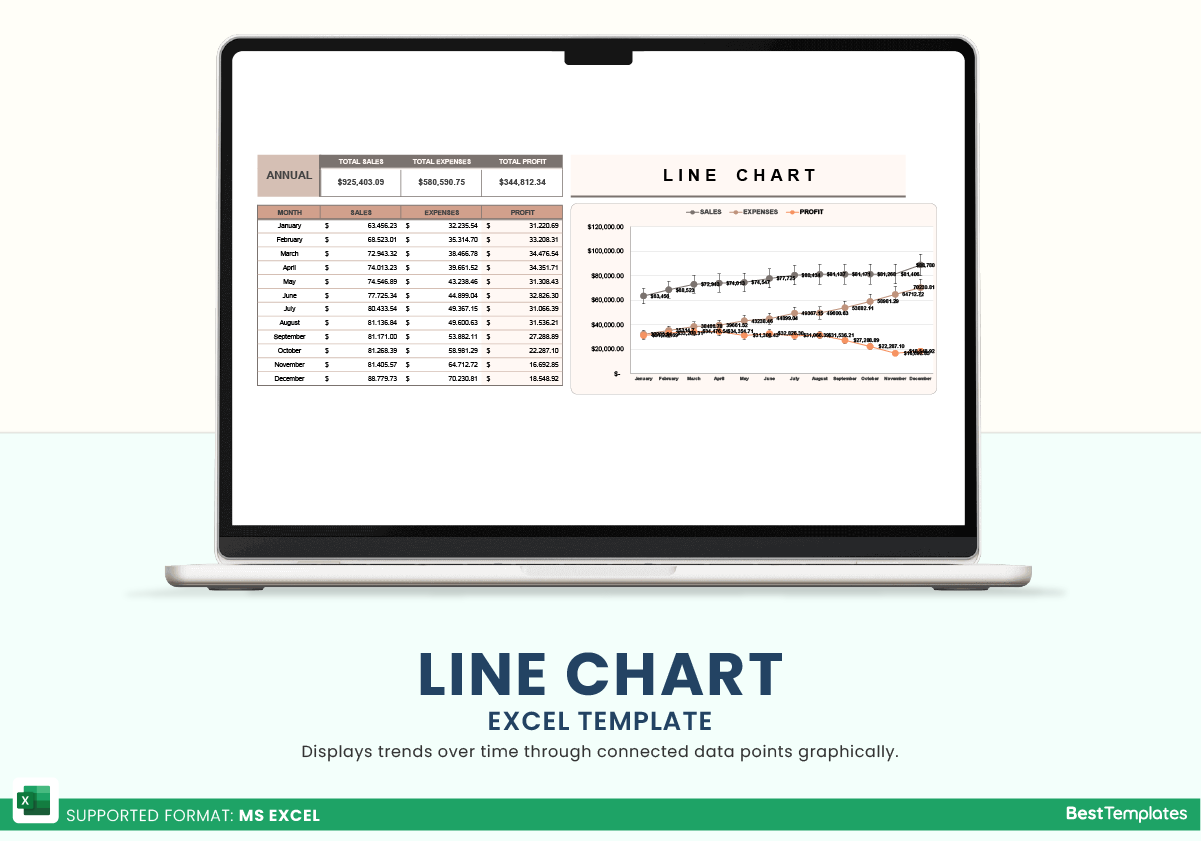
The Line Chart Excel Template from Besttemplates.com is a versatile tool designed to help you track and visualize your financial performance over time. Whether you’re managing a business or keeping an eye on personal finances, this template provides a clear, visual representation of your sales, expenses, and profit on a monthly and annual basis.
Key Features:
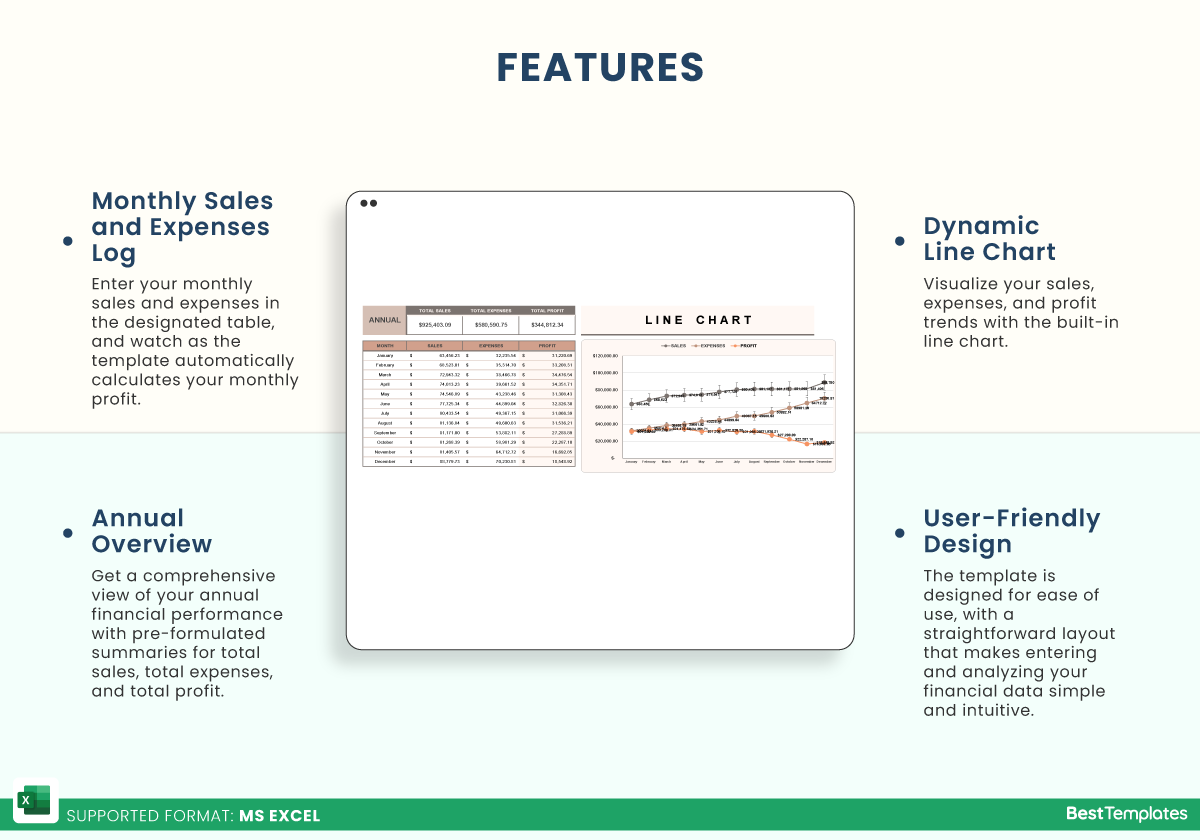
- Monthly Sales and Expenses Log: Enter your monthly sales and expenses in the designated table, and watch as the template automatically calculates your monthly profit. This feature simplifies financial tracking, ensuring you have accurate data at your fingertips.
- Annual Overview: Get a comprehensive view of your annual financial performance with pre-formulated summaries for total sales, total expenses, and total profit. This overview allows you to quickly assess your business’s yearly growth and financial health.
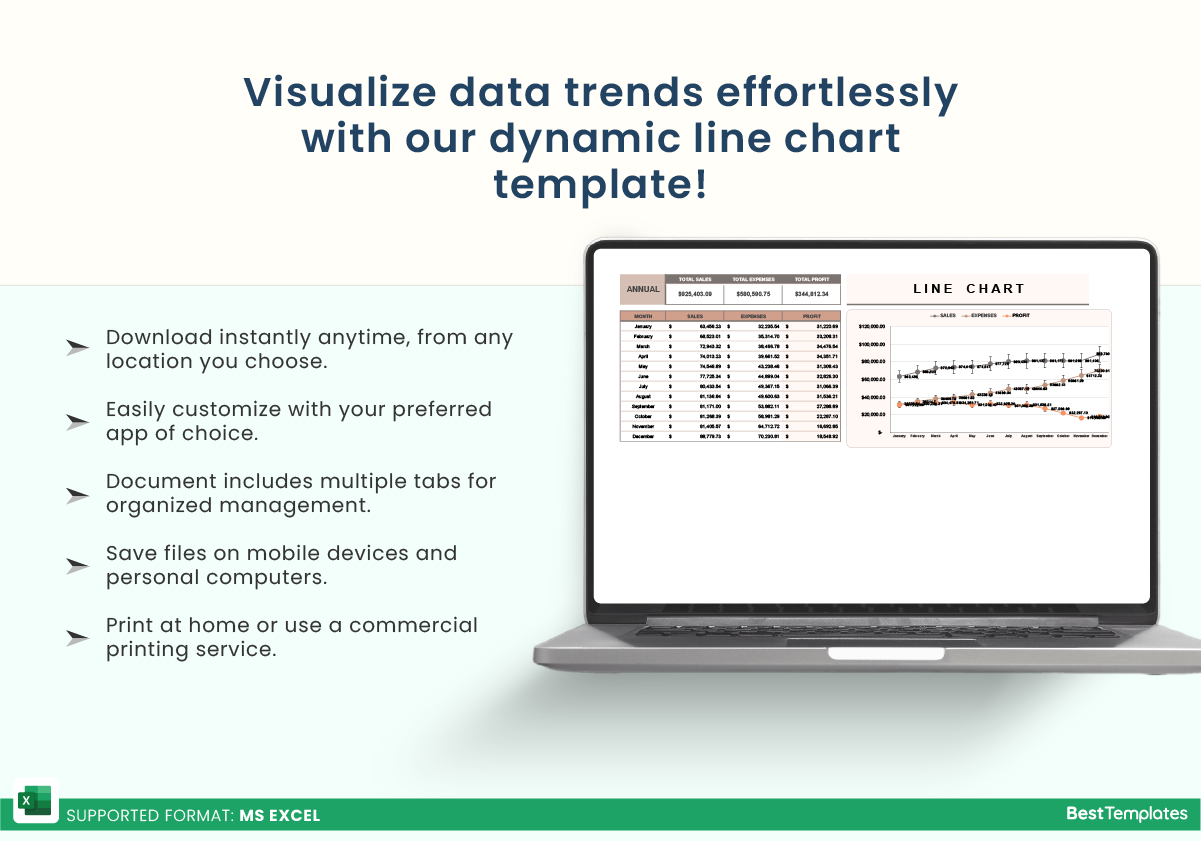
- Dynamic Line Chart: Visualize your sales, expenses, and profit trends with the built-in line chart. This chart updates automatically based on the data you enter, providing a clear picture of your financial trajectory throughout the year.
- User-Friendly Design: The template is designed for ease of use, with a straightforward layout that makes entering and analyzing your financial data simple and intuitive.
The Line Chart Excel Template from Besttemplates.com is ideal for anyone looking to gain insights into their financial performance. By logging monthly sales and expenses, and viewing trends in the dynamic line chart, you can make informed decisions and keep your finances on track throughout the year.
Additional Information
| Available Formats | MS Excel |
|---|
Additional Product Info
- Compatibility: Excel 2013, 2016, 2019, 2021, Office 365
- Functionality: No VBA Macros or custom scripts needed
- Orientation Options: Portrait/Landscape
- Color Mode: RGB Color Space
- License Type: Standard License
- Customization: Easily editable and customizable
- Font Style: Business standard fonts are used
- Digital Optimization: Optimized for digital use only
- Printing Suitability: Suitable for printing


 No products in the cart.