Heatmap Excel Template
$9.00
Available in stock
Already have an account? Login
Add to cart| Available Formats | MS Excel |
|---|
Description
Heatmap Excel Template by Besttemplates.com
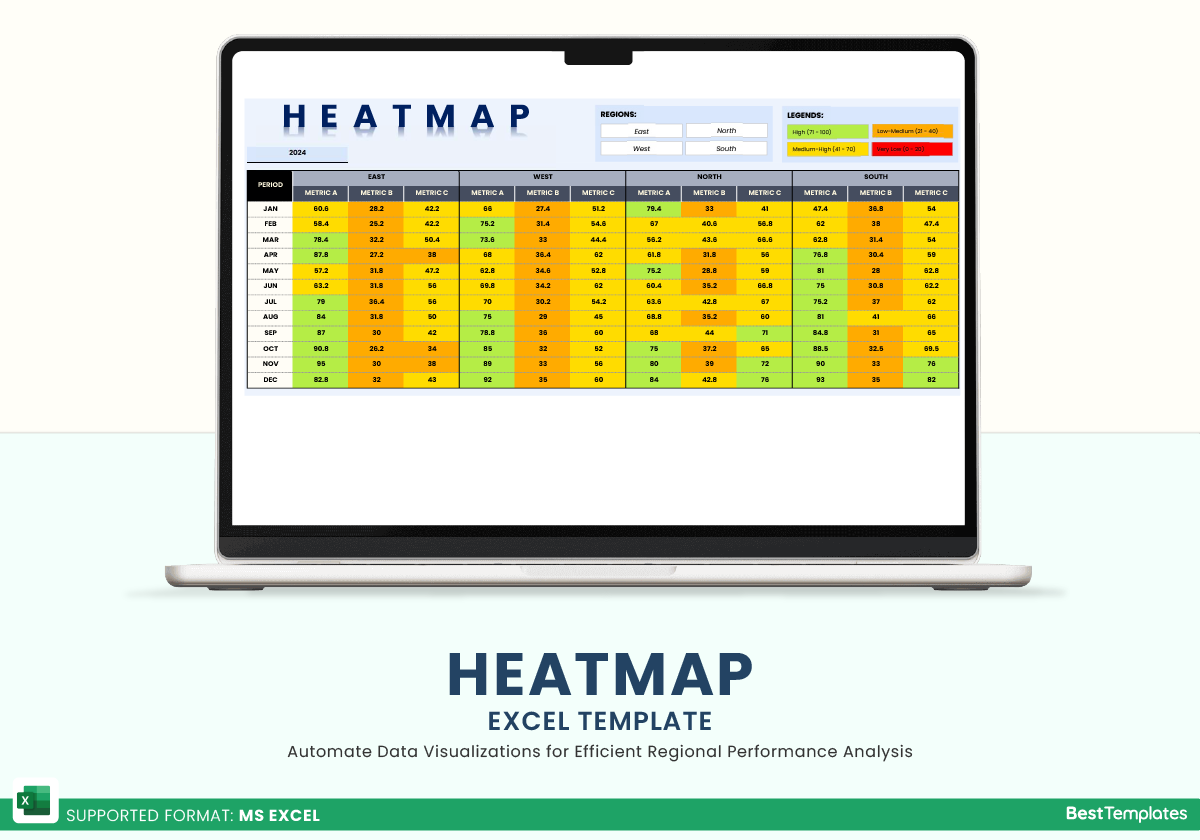
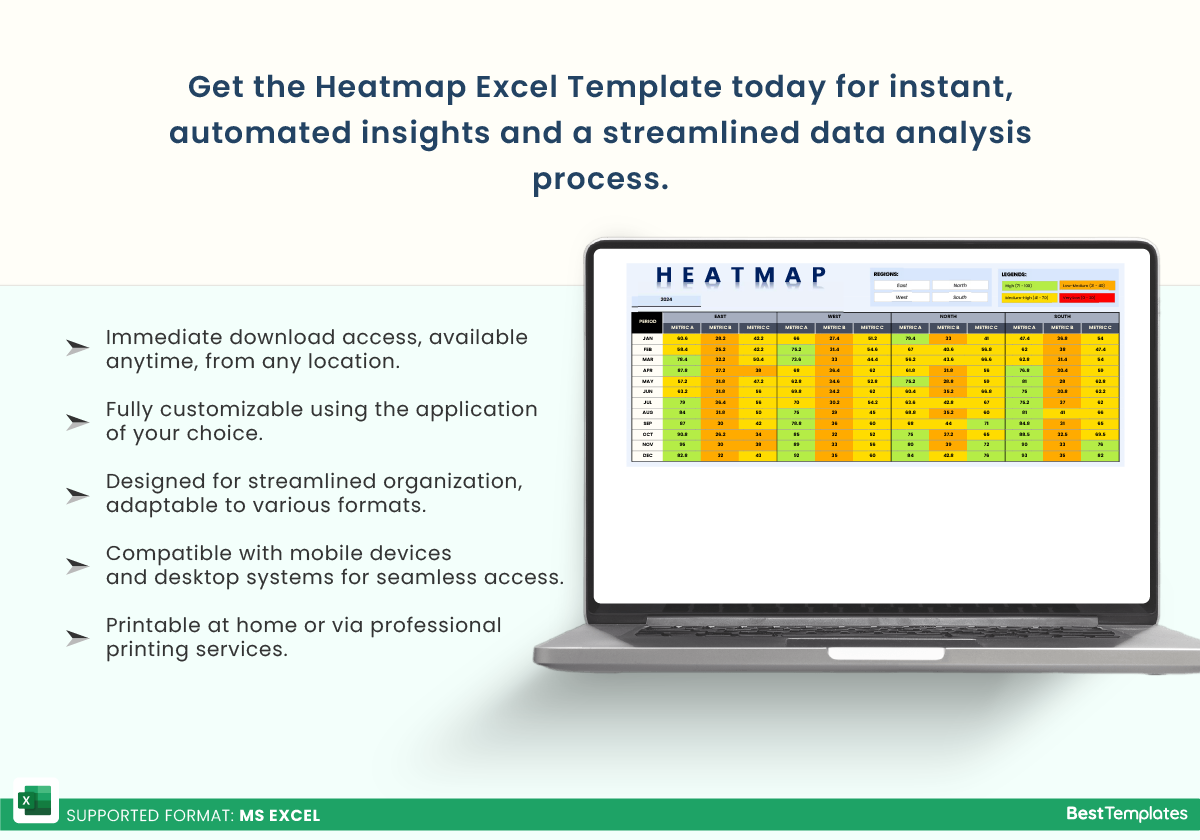
The Heatmap Excel Template from Besttemplates.com is a powerful tool designed to streamline data analysis through visually compelling heatmaps. This template is an excellent choice for users who need quick insights into regional trends and performance metrics across multiple months, whether in sales, marketing, or operational data. The Heatmap Excel Template is automated to provide instant visualization based on the data provided, so users can get real-time insights with minimal setup. With sections dedicated to data input, visualization, and a fully automated analysis dashboard, this template enables users to track monthly performance and pinpoint high and low trends across regions seamlessly.
Key Features:
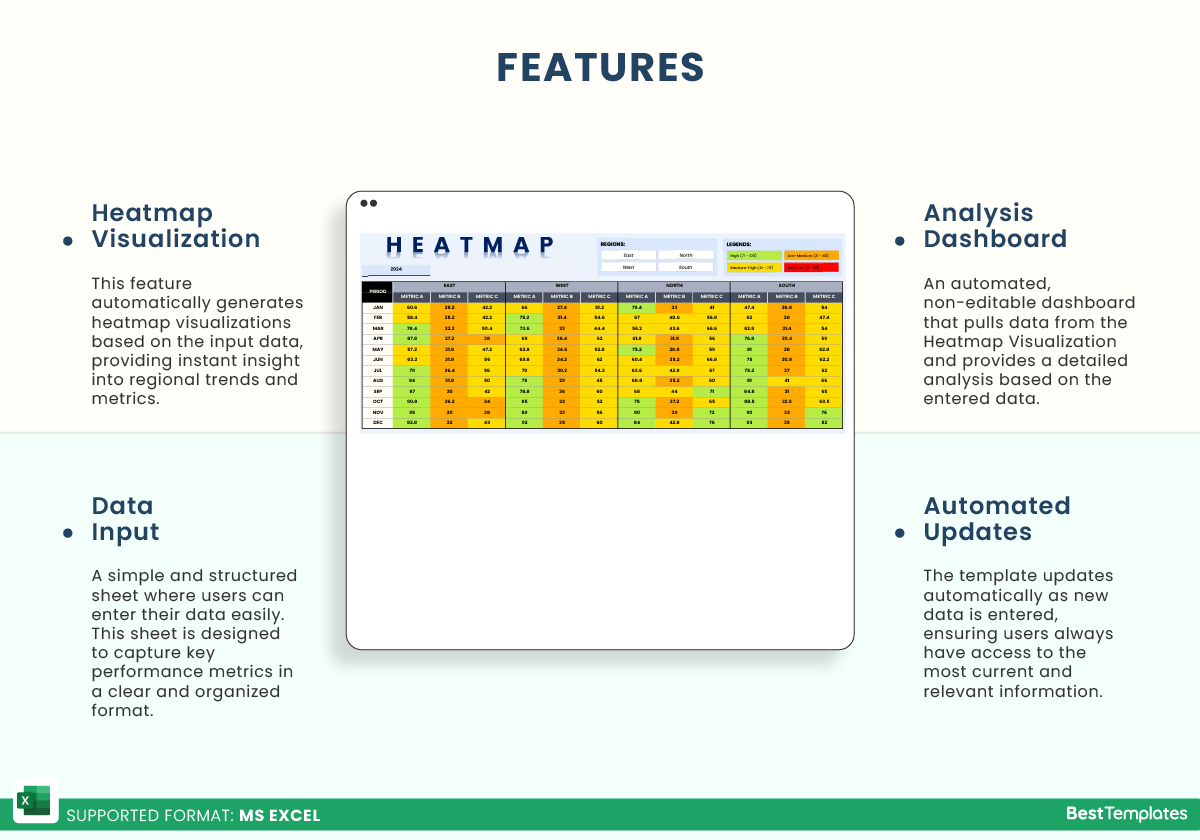
- Heatmap Visualization Sheet: This primary sheet is automated and not editable, showcasing data visualizations in heatmap format. The heatmap is automatically updated to reflect monthly performance metrics for each region, ensuring real-time insights.
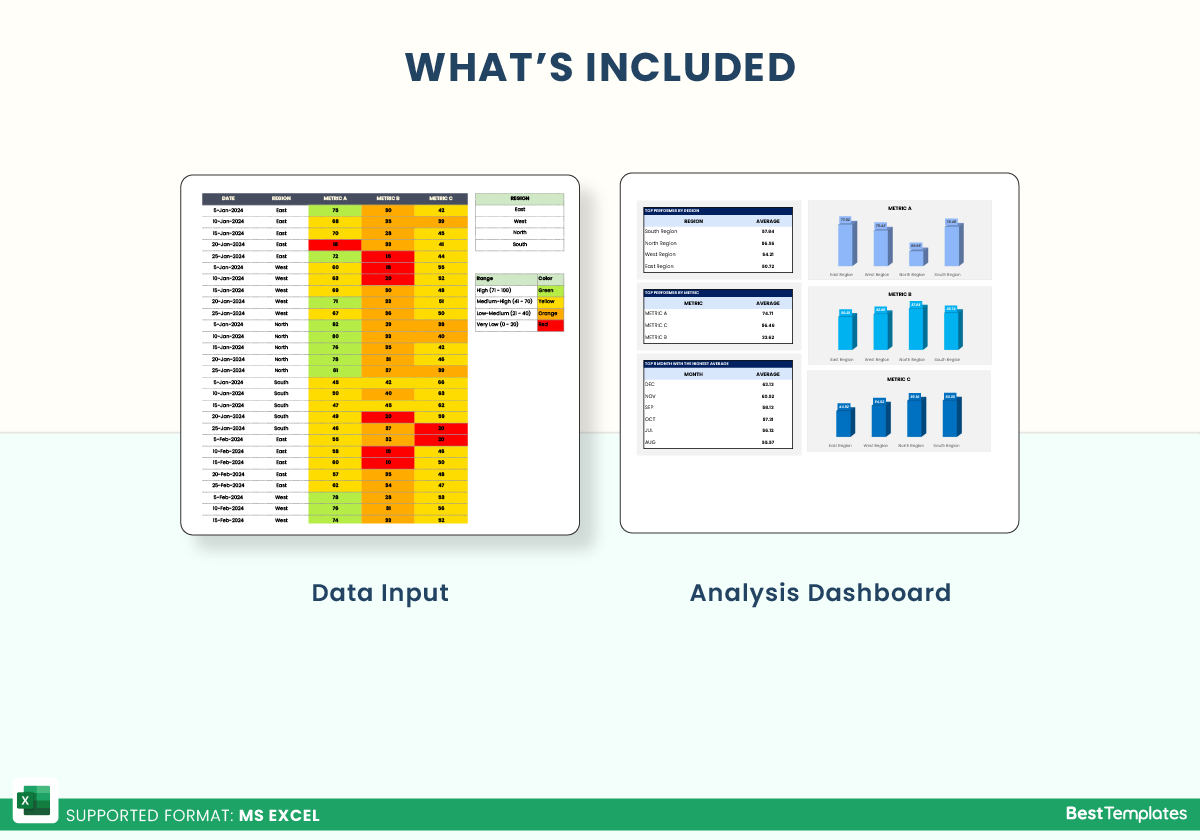
- Data Input Sheet: This sheet allows users to enter their data easily. Structured columns simplify data entry, letting users input metrics effortlessly.
- Analysis Dashboard: An advanced, non-editable dashboard that pulls from the Heatmap Visualization to present a comprehensive analysis. This dashboard is automated and updates dynamically as new data is entered in the Data Input sheet.
Designed for simplicity, the Heatmap Excel Template offers a full solution to users who want a quick and efficient way to view data trends without manual effort. The template’s automation in both the visualization and analysis sheets enables users to focus on insights rather than formatting and calculation, making it perfect for professionals looking for actionable data with just a few clicks.
Additional Information
| Available Formats | MS Excel |
|---|
Additional Product Info
- Compatibility: Excel 2013, 2016, 2019, 2021, Office 365
- Functionality: No VBA Macros or custom scripts needed
- Orientation Options: Portrait/Landscape
- Color Mode: RGB Color Space
- License Type: Standard License
- Customization: Easily editable and customizable
- Font Style: Business standard fonts are used
- Digital Optimization: Optimized for digital use only
- Printing Suitability: Suitable for printing


 No products in the cart.