Funnel Chart Excel Template
$9.00
Available in stock
Already have an account? Login
Add to cart| Available Formats | MS Excel |
|---|
Description
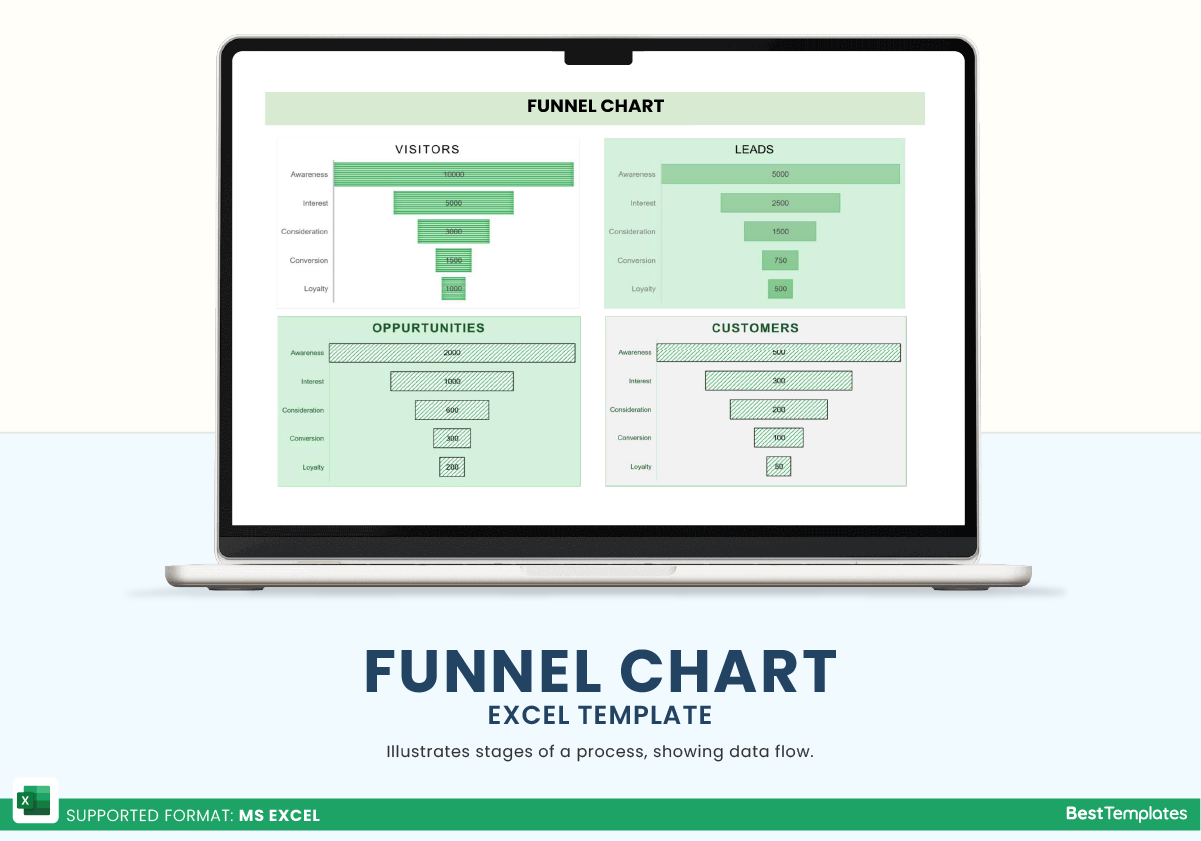
Enhance your sales and marketing analysis with the Funnel Chart Excel Template from Besttemplates.com. This powerful template is designed to help you visualize your conversion process clearly, allowing you to track how potential customers move through your sales funnel. In the “Funnel Chart Details” sheet, simply enter the necessary data based on the provided parameters, such as the number of visitors, leads, opportunities, and customers. Once you’ve entered your details, switch to the “Chart” sheet, where you will find four visually engaging funnel charts. These charts represent each stage of your sales process—Visitors, Leads, Opportunities, and Customers—making it easy to analyze and communicate your performance metrics at a glance. This template is ideal for sales teams, marketing analysts, and business owners looking to optimize their conversion strategies and identify areas for improvement.
Key Features:
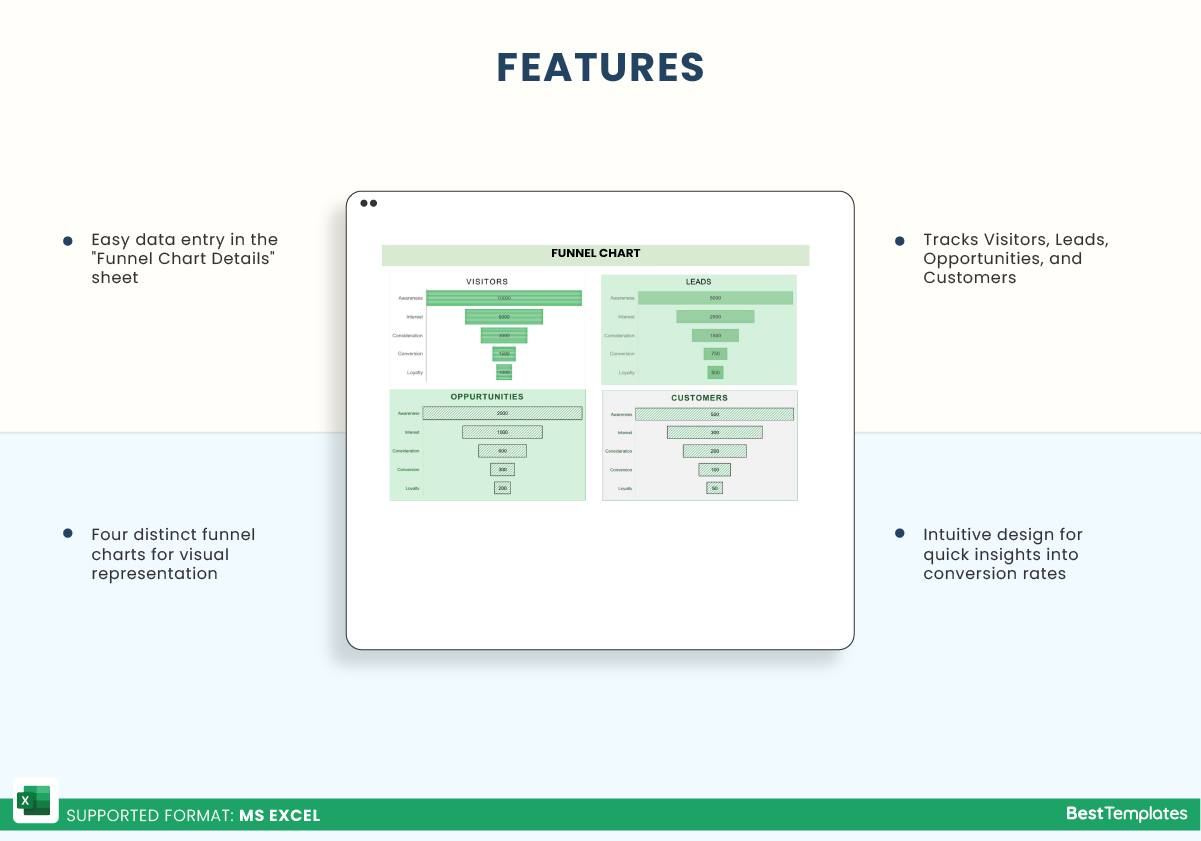
- Easy data entry in the “Funnel Chart Details” sheet
- Four distinct funnel charts for visual representation
- Tracks Visitors, Leads, Opportunities, and Customers
- Intuitive design for quick insights into conversion rates
- Perfect for sales and marketing analysis
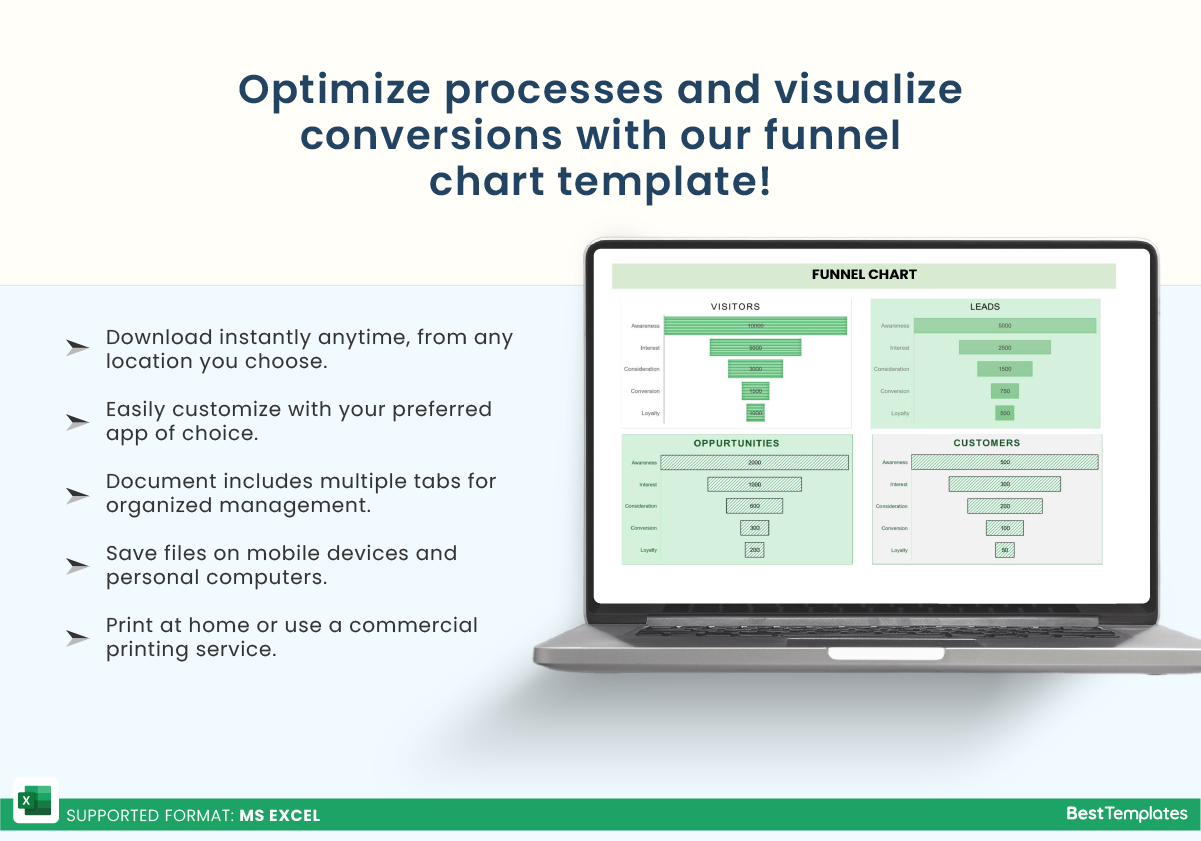
With the Funnel Chart Excel Template from Besttemplates.com, you can transform complex data into clear visualizations that enhance your decision-making process. This template not only simplifies your analysis but also helps you pinpoint where improvements are needed in your sales funnel, making it an essential tool for any business focused on growth.
Additional Information
| Available Formats | MS Excel |
|---|
Additional Product Info
- Compatibility: Excel 2013, 2016, 2019, 2021, Office 365
- Functionality: No VBA Macros or custom scripts needed
- Orientation Options: Portrait/Landscape
- Color Mode: RGB Color Space
- License Type: Standard License
- Customization: Easily editable and customizable
- Font Style: Business standard fonts are used
- Digital Optimization: Optimized for digital use only
- Printing Suitability: Suitable for printing


 No products in the cart.