Financial Analysis Excel Template
$9.00
Available in stock
Already have an account? Login
Add to cart| Available Formats | MS Excel |
|---|
Description
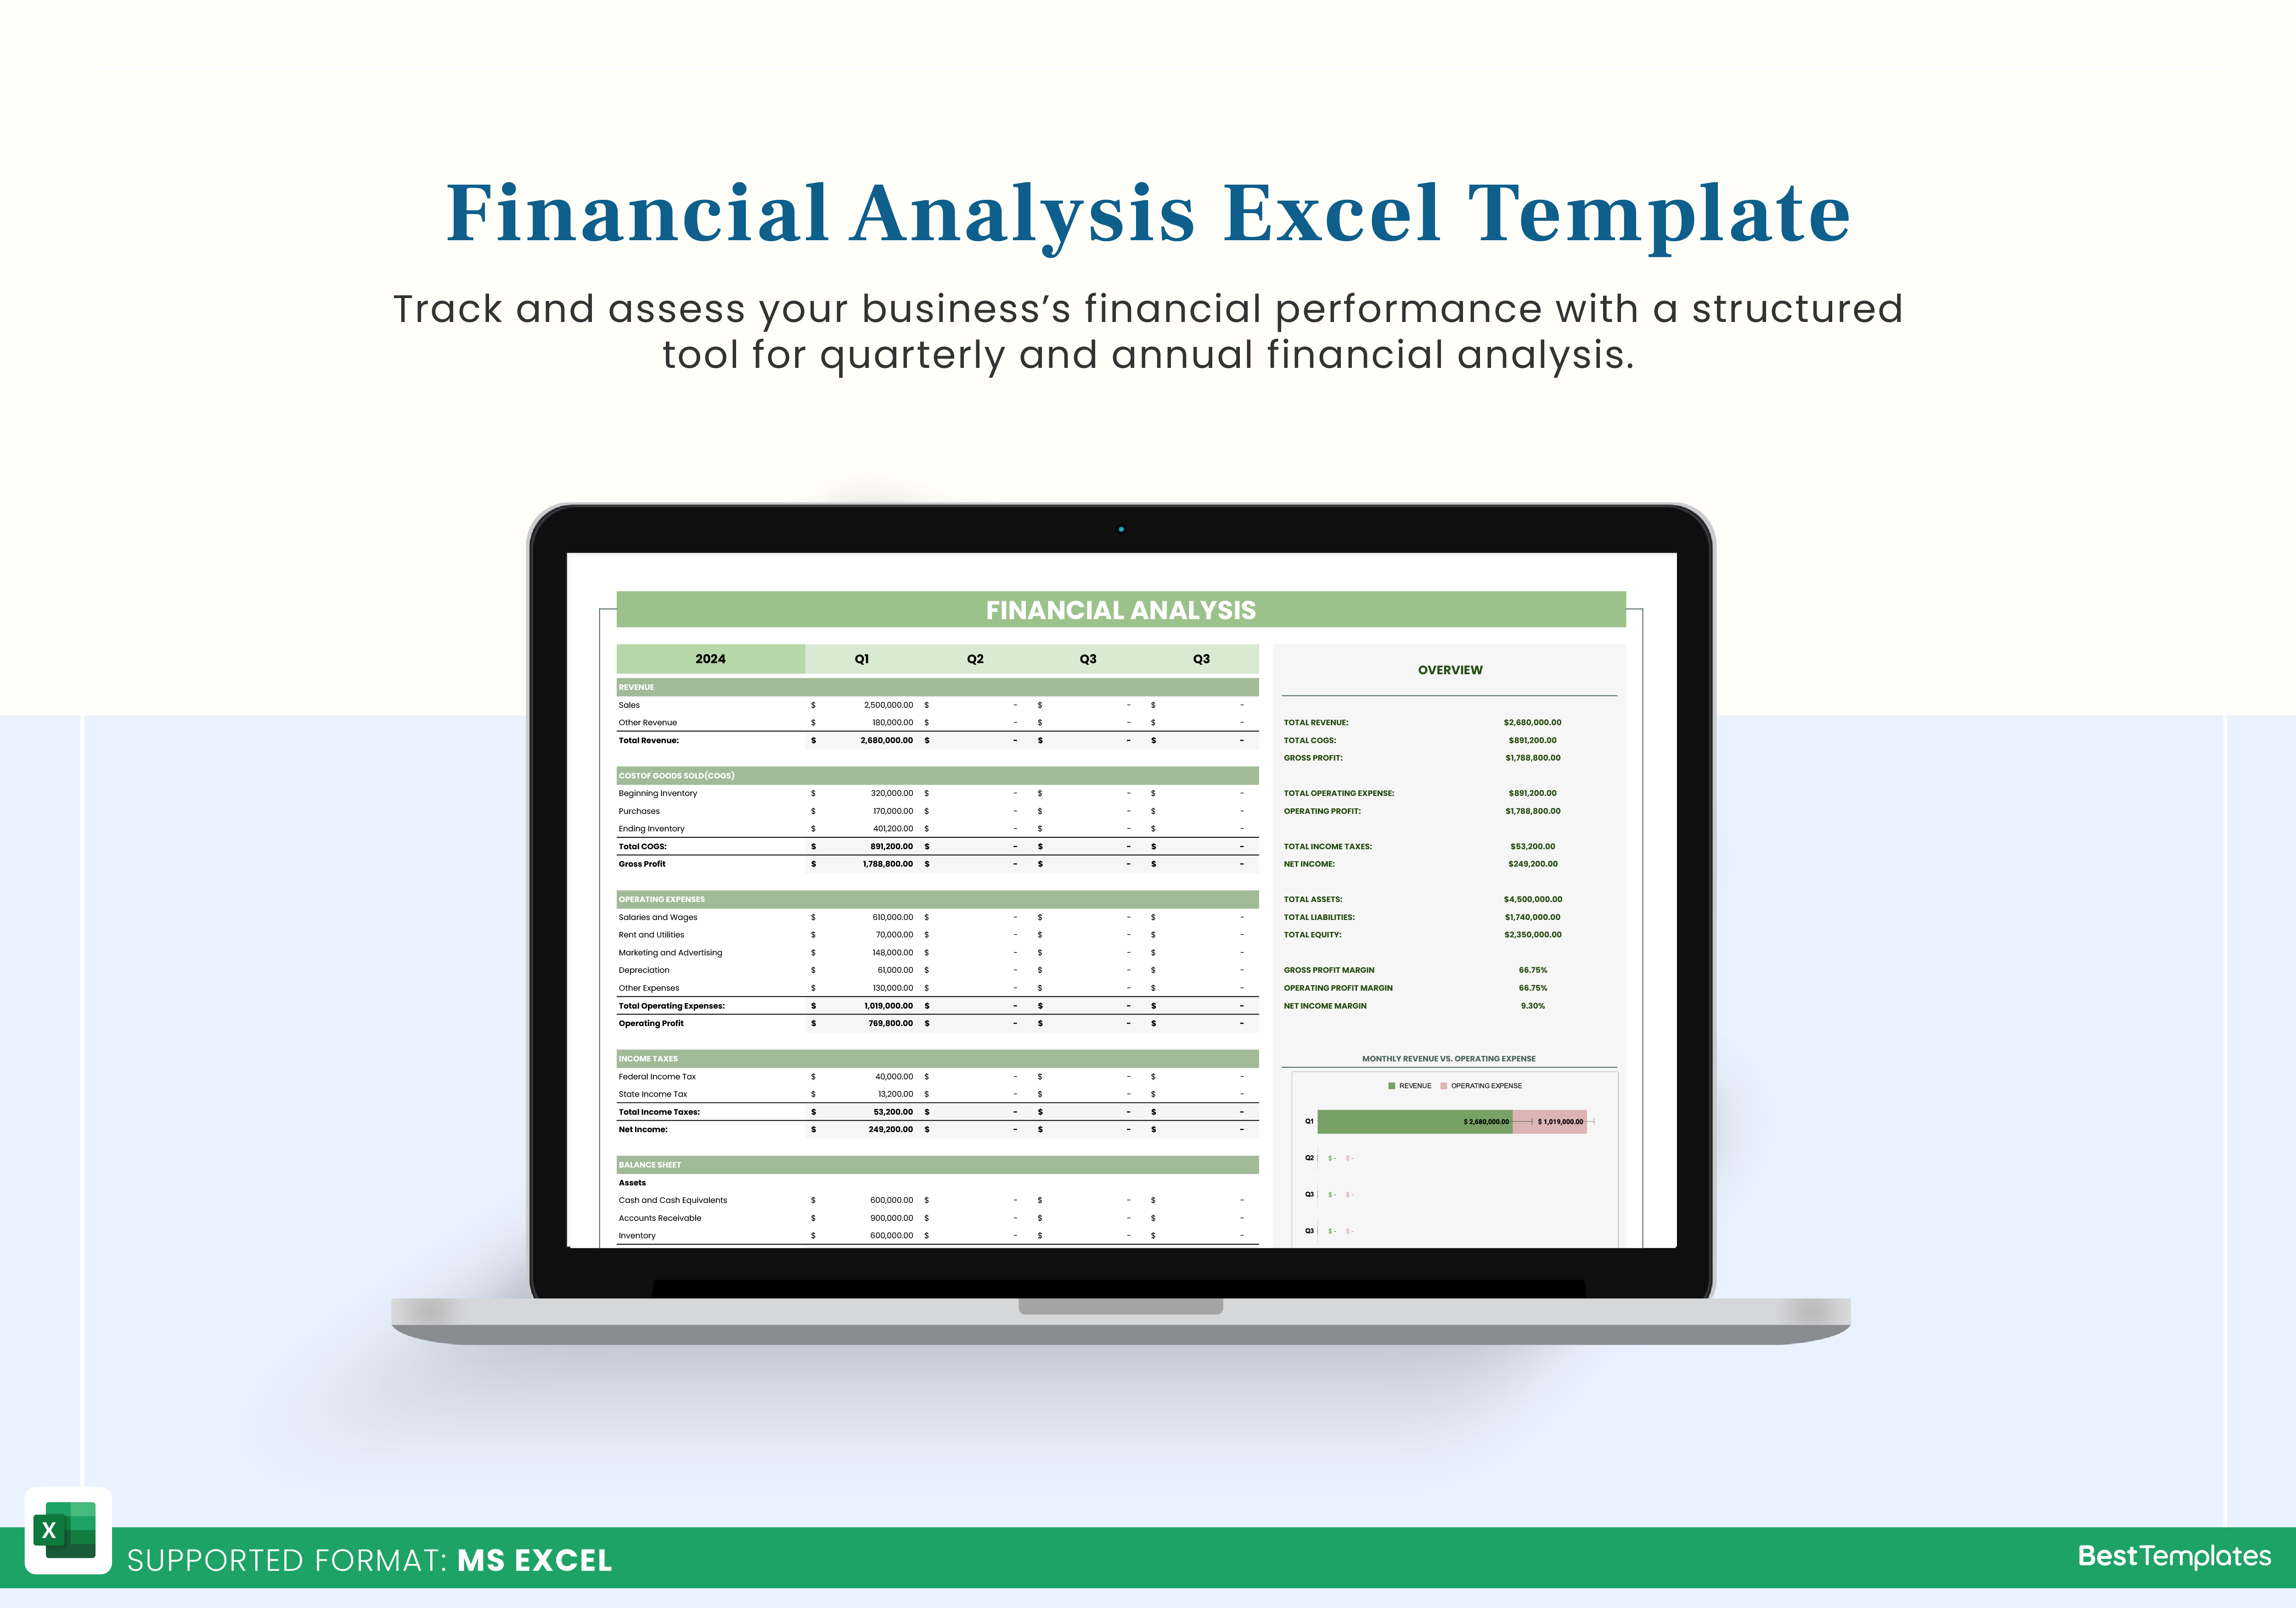
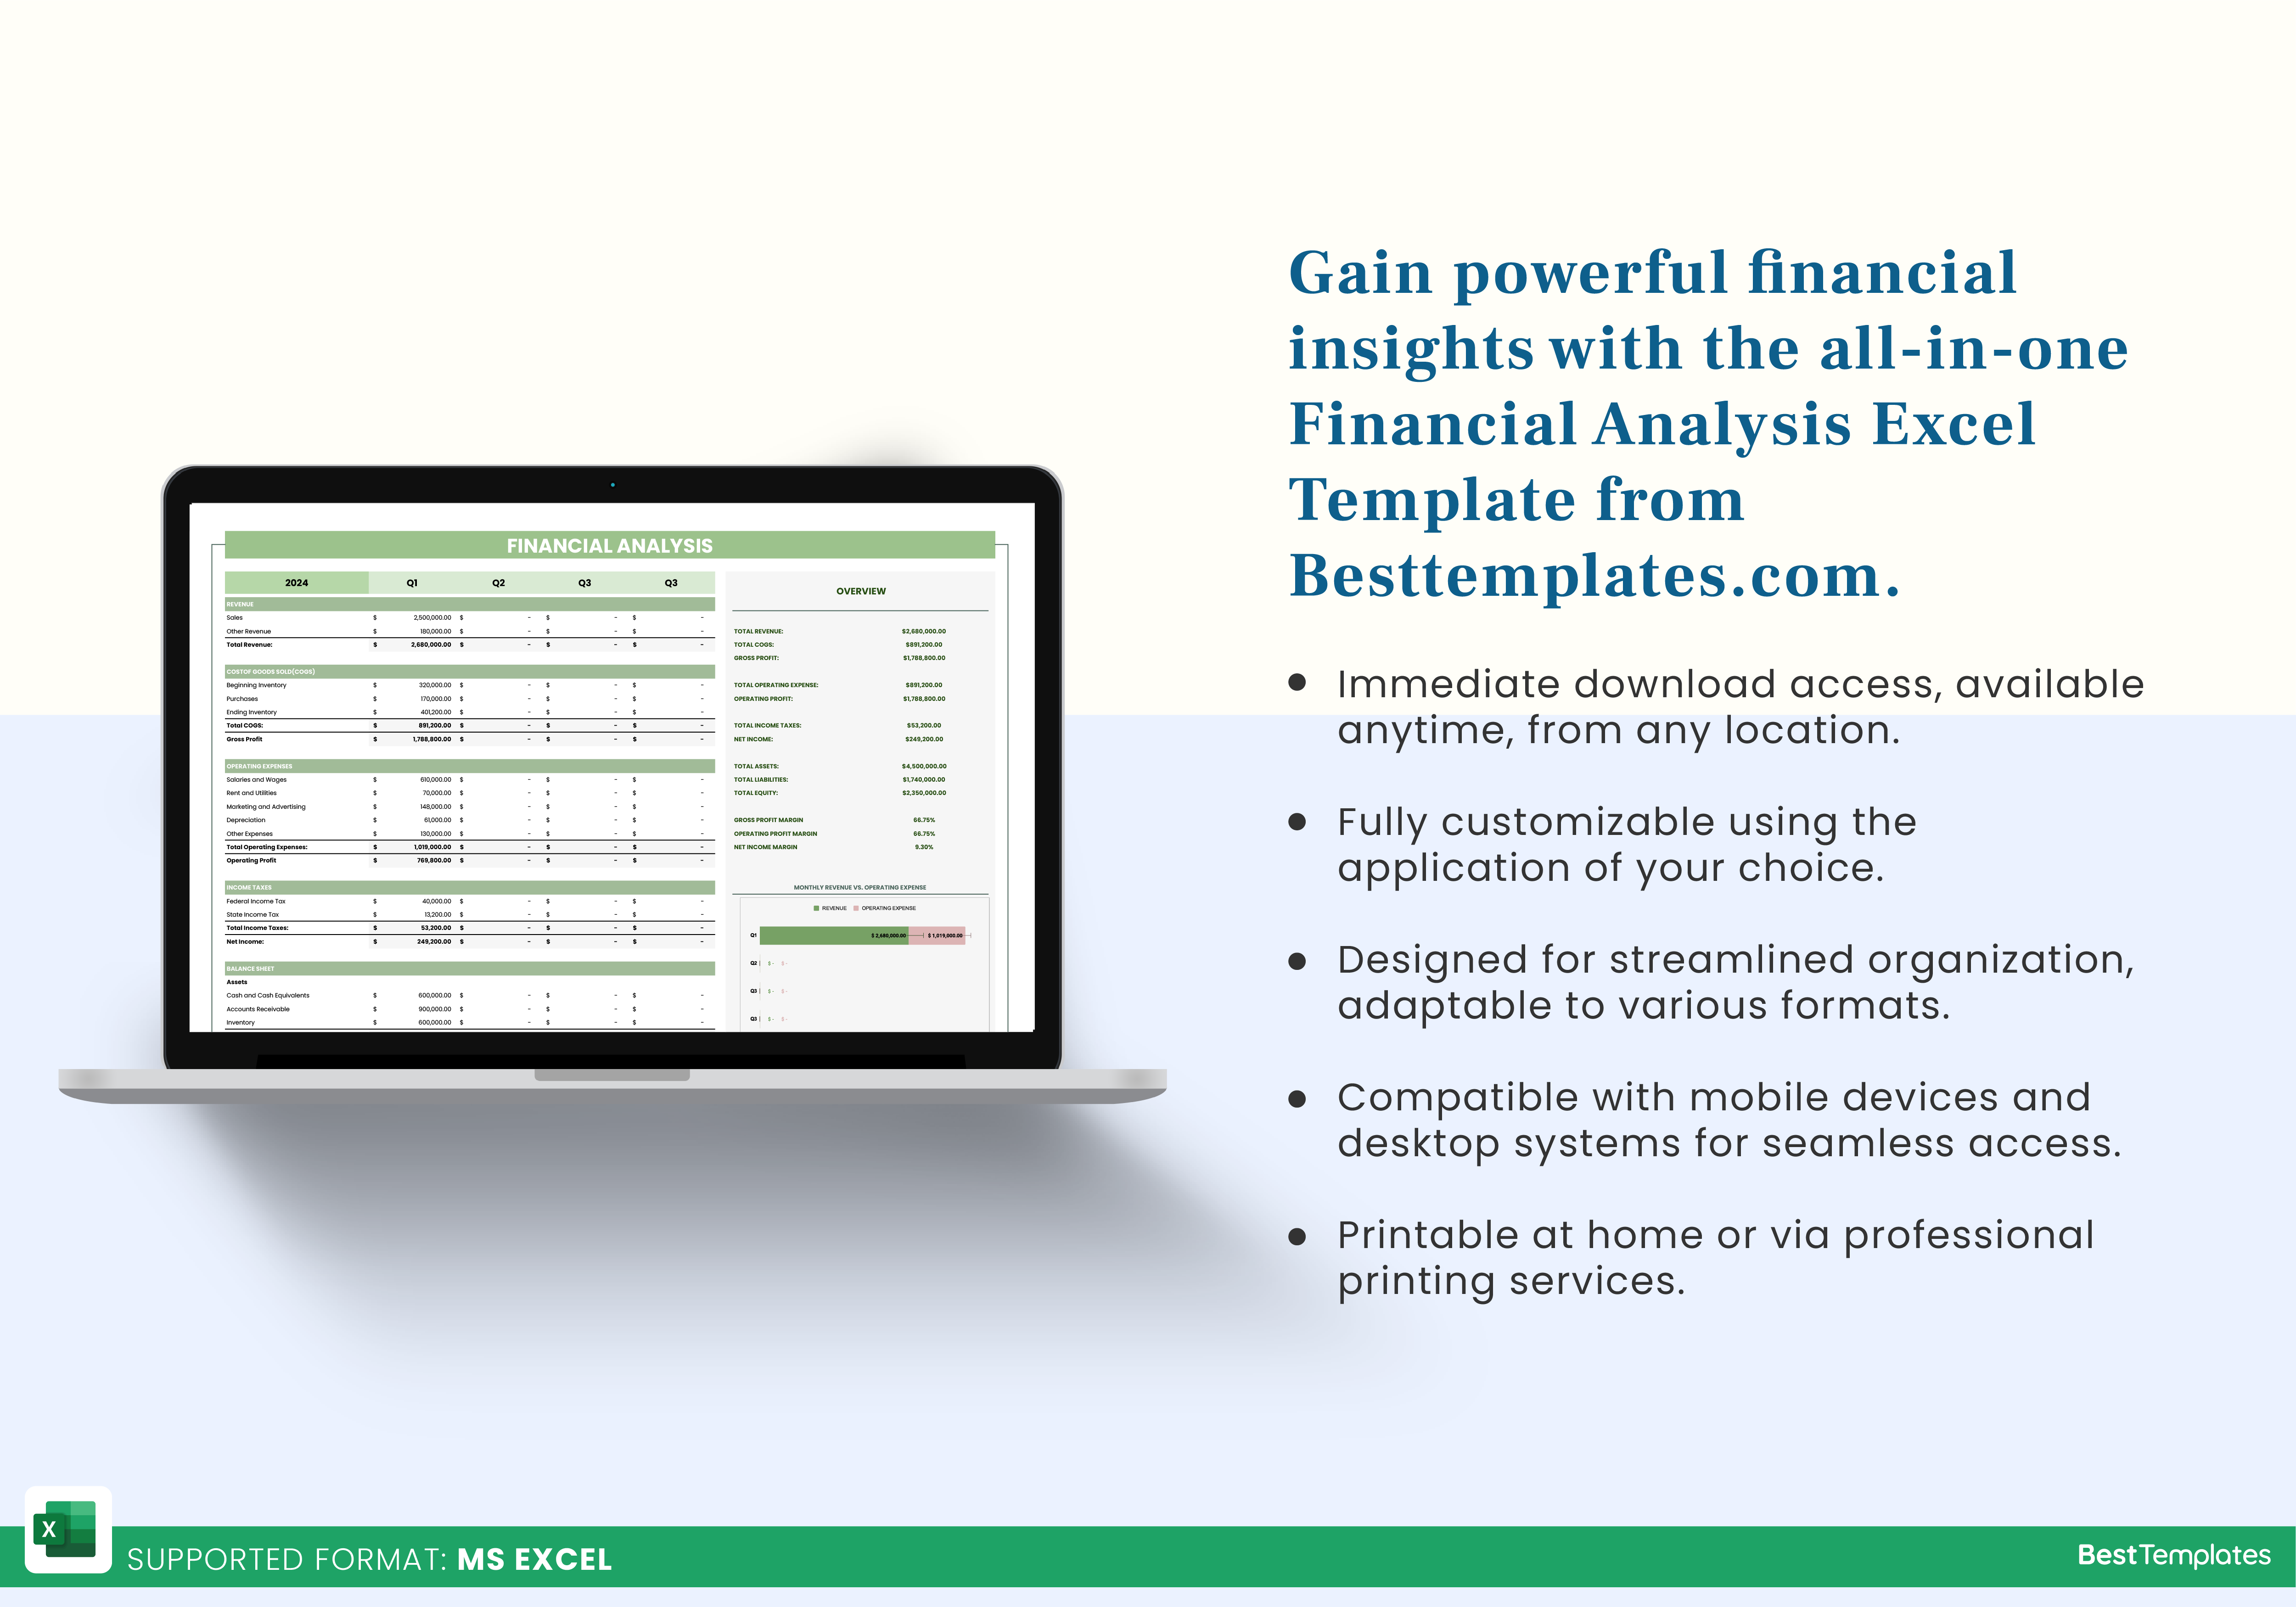
The Financial Analysis Excel Template from Besttemplates.com is an essential tool for businesses looking to gain insights into their financial performance on a quarterly and annual basis. This template allows users to input key financial data for each month of the quarter, including revenue, cost of goods sold, operating expenses, income taxes, and balance sheet details such as liabilities and equity. The template automatically calculates totals and key financial ratios, providing an accurate financial overview with minimal effort. Additionally, it features visually engaging charts to compare monthly and quarterly financial metrics.
Key Features:
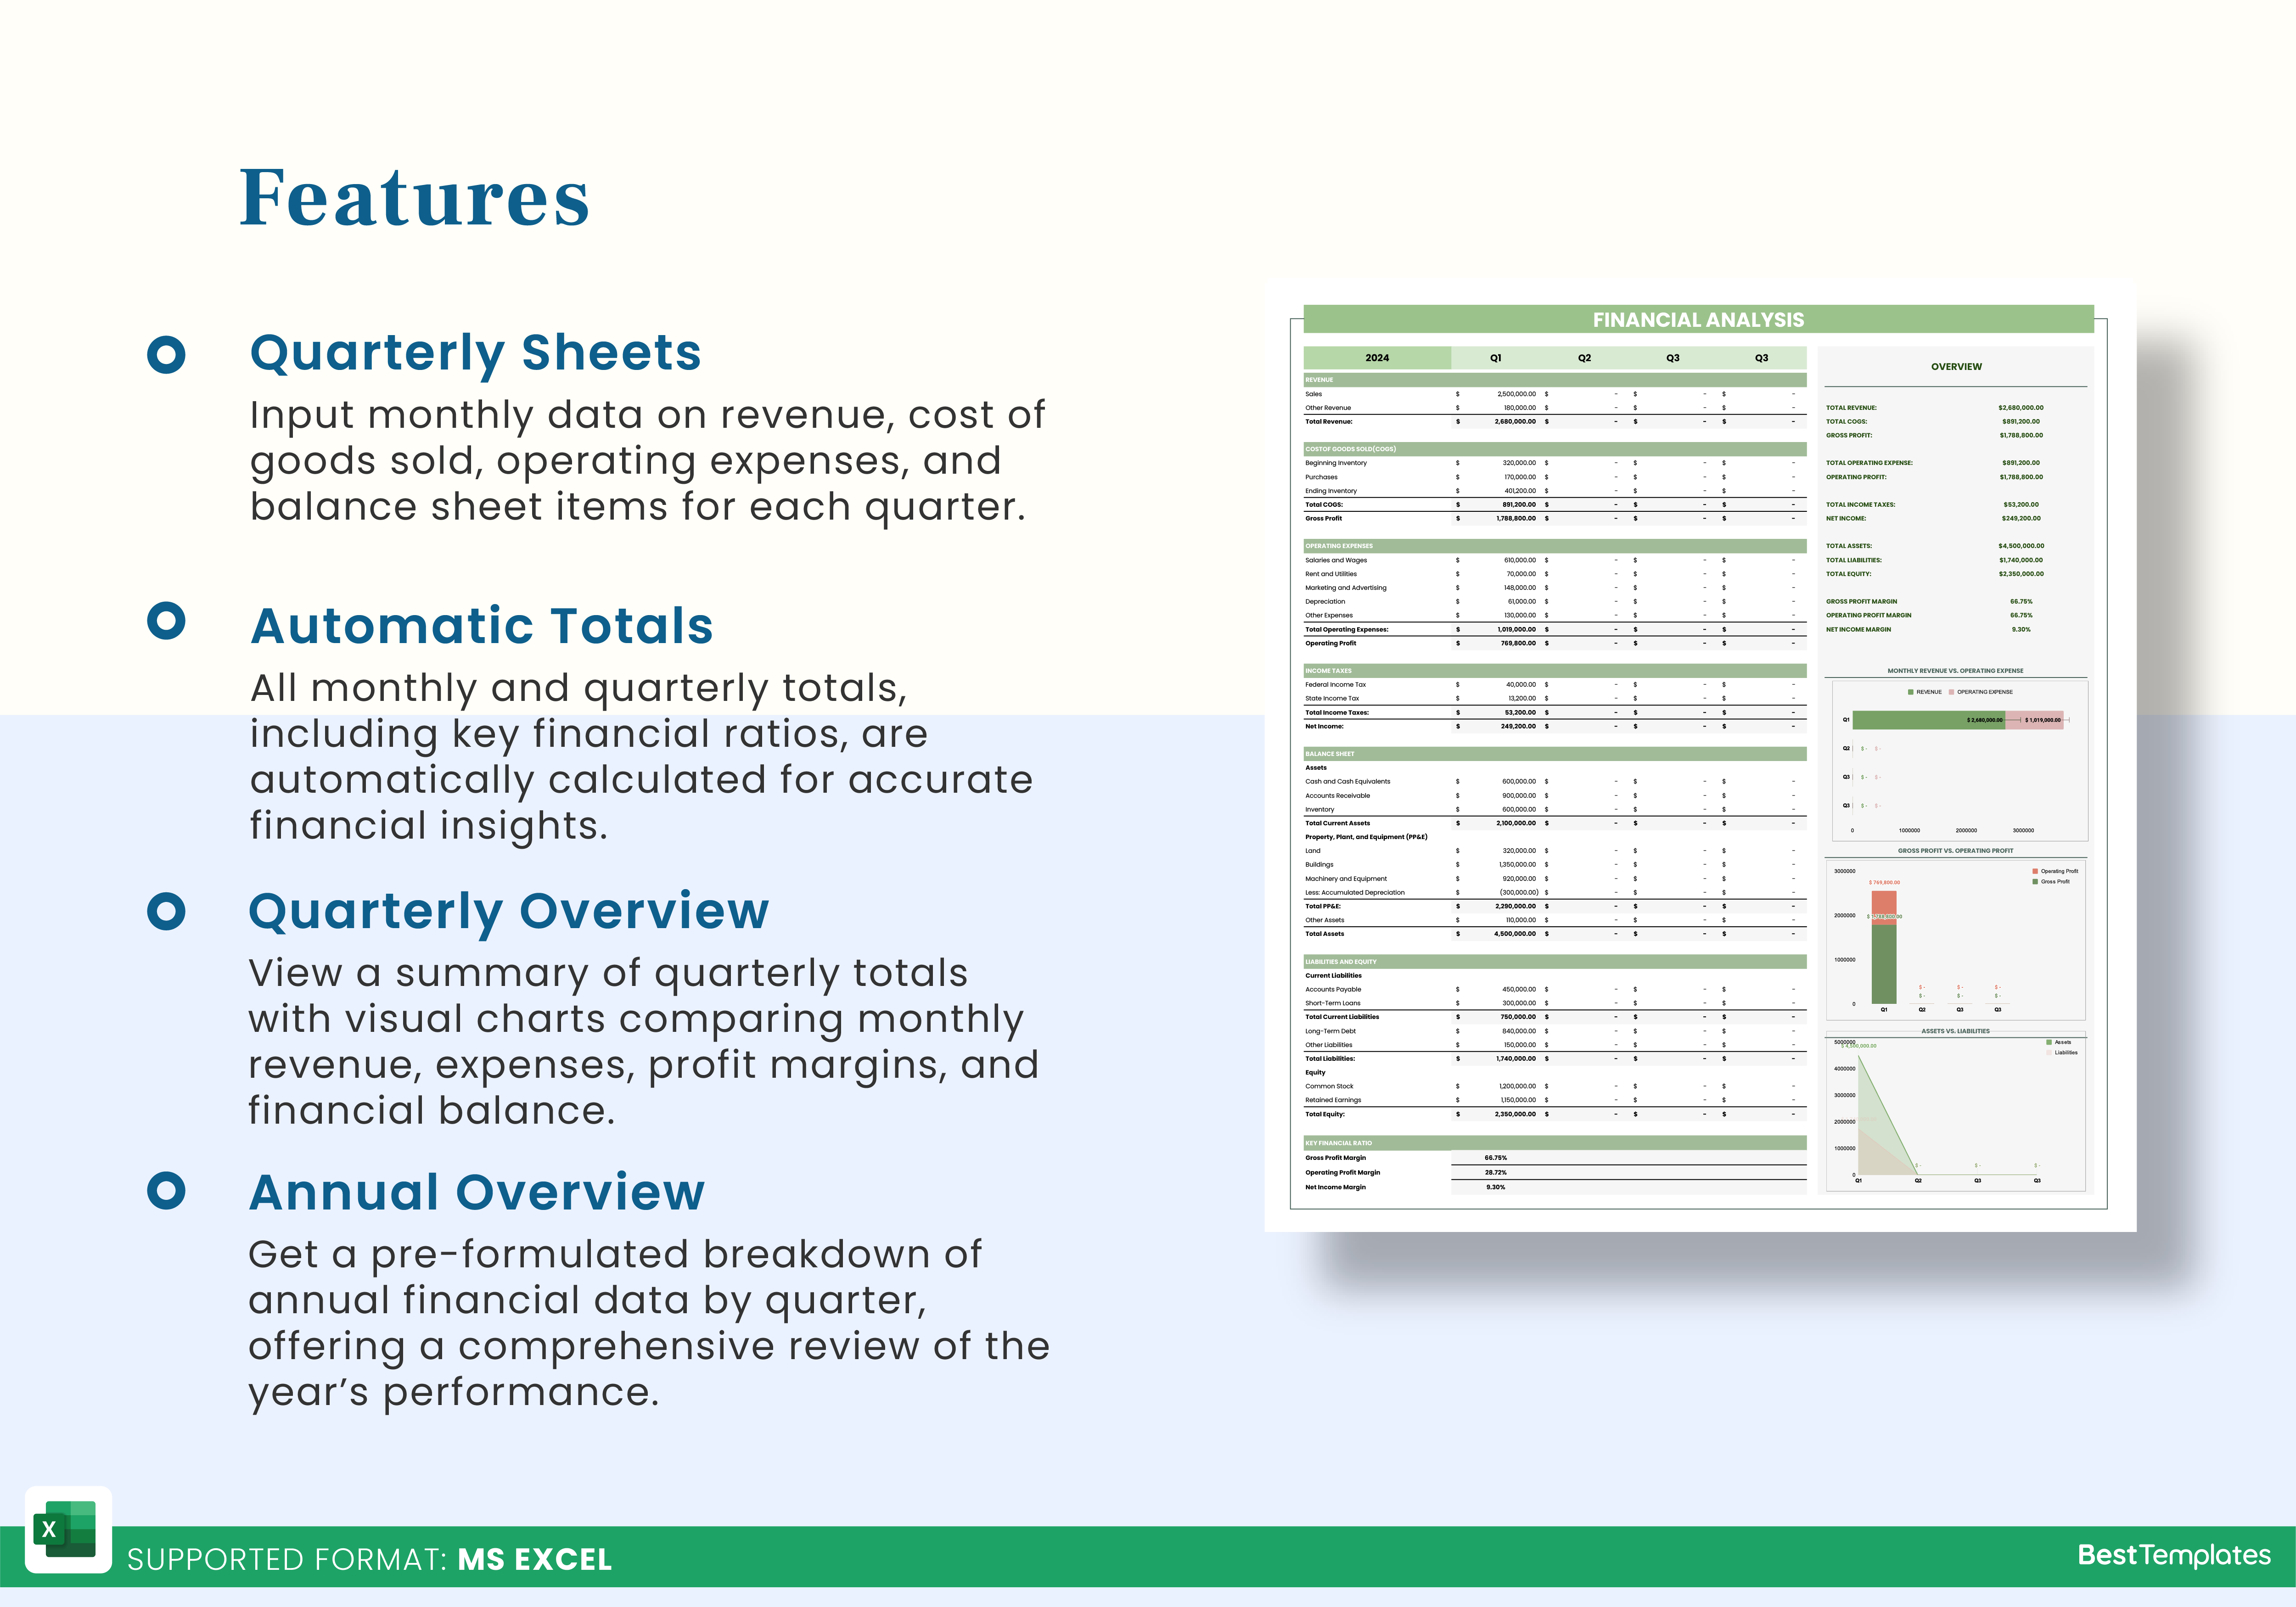
- Quarterly Financial Sheets: Input revenue, cost of goods sold, operating expenses, income taxes, balance sheet items, and liabilities and equity for each month of the quarter.
- Automatic Formulation of Totals: All monthly and quarterly totals are automatically calculated, including key financial ratios.
- Quarterly Overview: View totals for each quarter alongside visual charts comparing monthly revenue vs. operating expenses, gross profit vs. operating profit, and assets vs. liabilities.
- Annual Overview Sheet: Pre-formulated to display the annual financial analysis, with a breakdown by quarter and a comprehensive overview of the annual financial data.
The Financial Analysis Excel Template from Besttemplates.com provides a complete and structured approach to financial tracking. By offering a detailed breakdown of financial data on a monthly, quarterly, and annual basis, this template makes it easier to assess profitability, manage liabilities, and compare key financial metrics.
Additional Information
| Available Formats | MS Excel |
|---|
Additional Product Info
- Compatibility: Excel 2021, Office 365
- Functionality: No VBA Macros or custom scripts needed
- Orientation Options: Portrait/Landscape
- Color Mode: RGB Color Space
- License Type: Standard License
- Customization: Easily editable and customizable
- Font Style: Business standard fonts are used
- Digital Optimization: Optimized for digital use only
- Printing Suitability: Suitable for printing


 No products in the cart.