Dynamic Histogram Excel Template
$14.99
Available in stock
Already have an account? Login
Add to cart| Available Formats | MS Excel |
|---|
Description
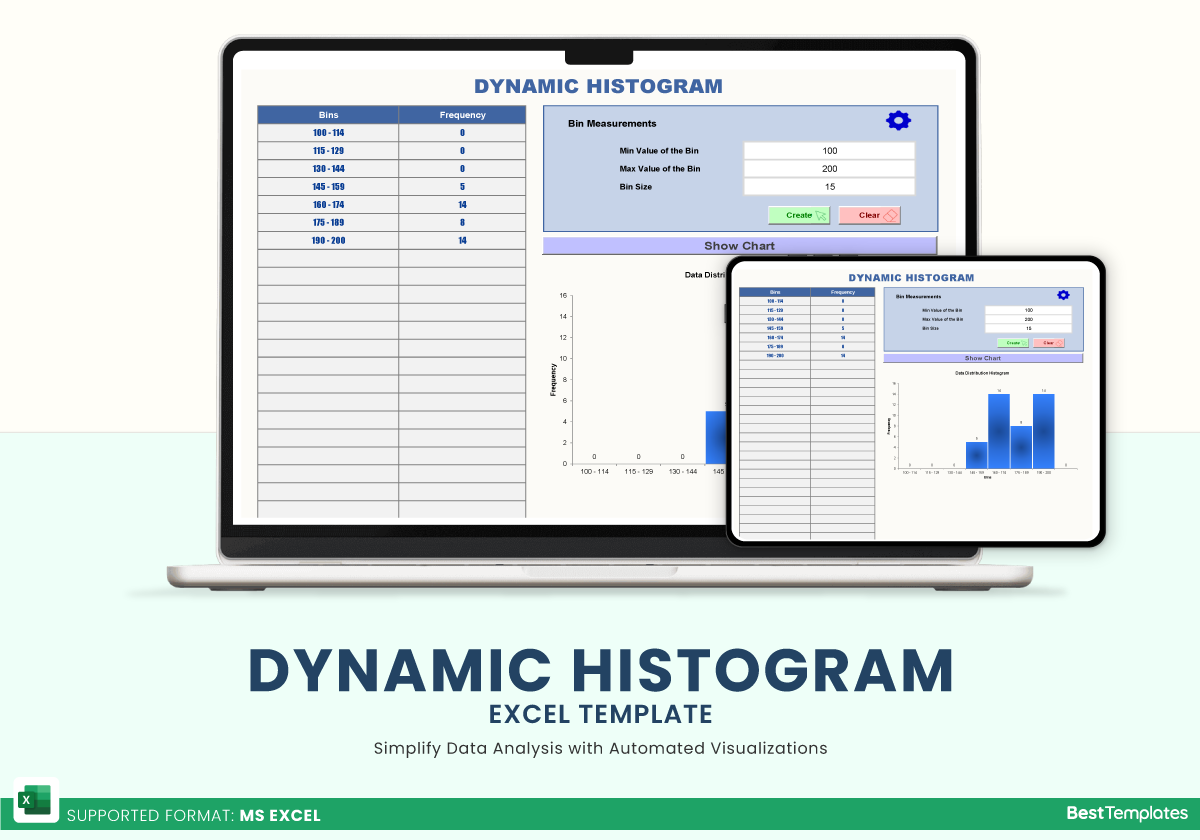
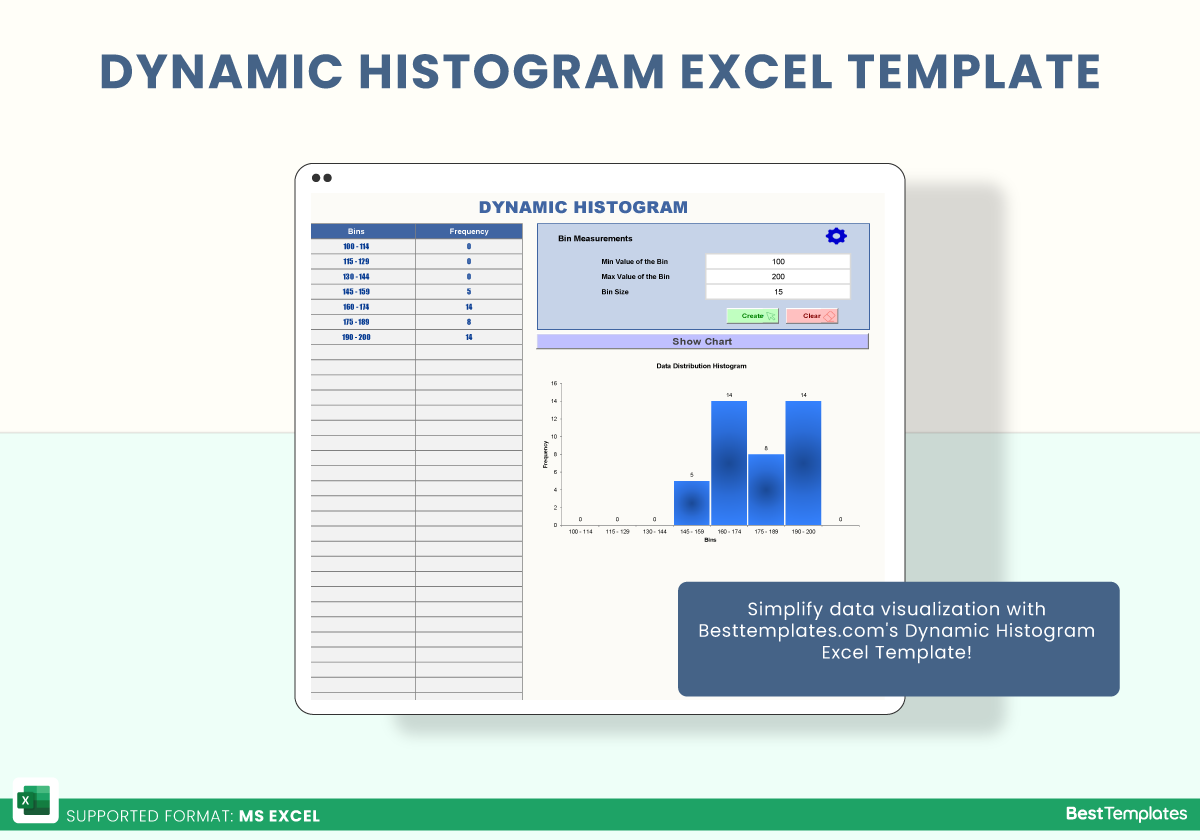
Transform your data into professional-grade visualizations with the Dynamic Histogram Excel Template from Besttemplates.com. This intuitive tool is designed to simplify data analysis and presentation, making it the perfect choice for students, analysts, and professionals alike. With automated features, customizable inputs, and a user-friendly interface, creating and managing histograms has never been easier. Simply input your data, adjust bin measurements, and watch the template do the rest. Save time, reduce errors, and deliver clear, impactful insights with this dynamic solution.
Key Features:
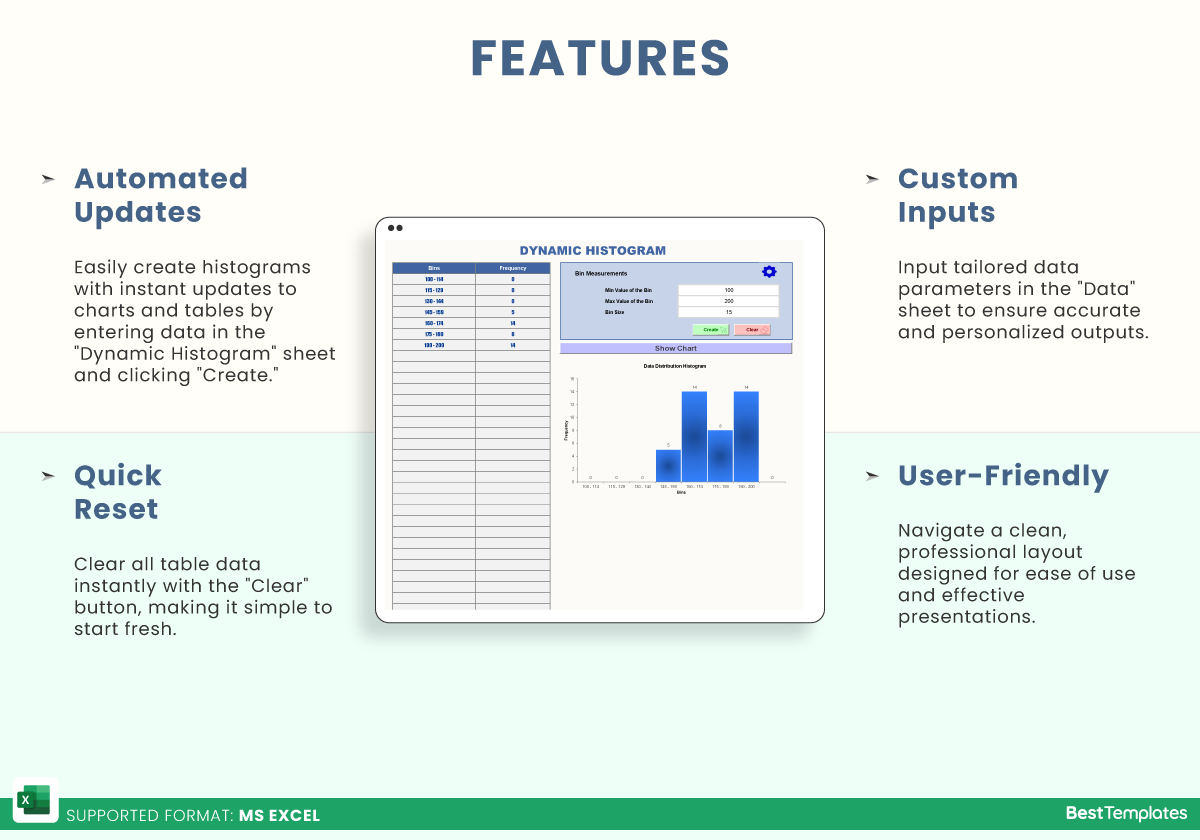
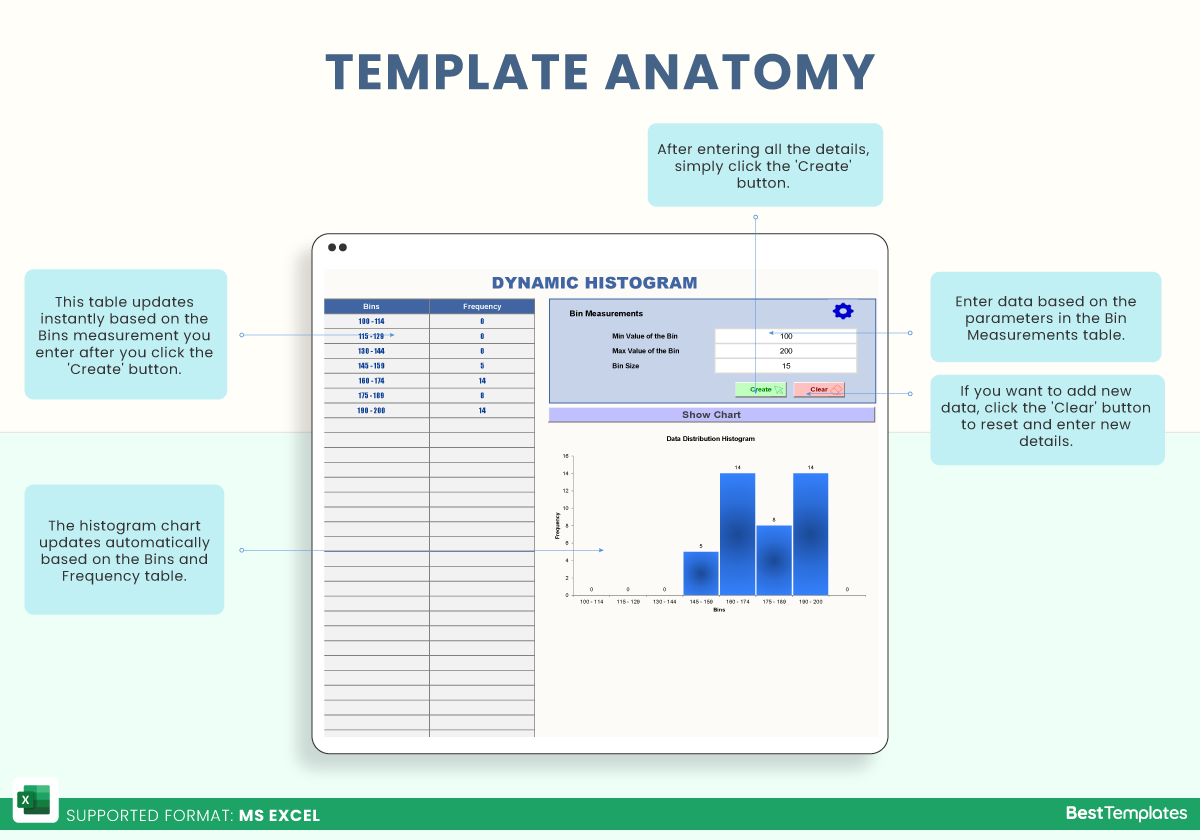
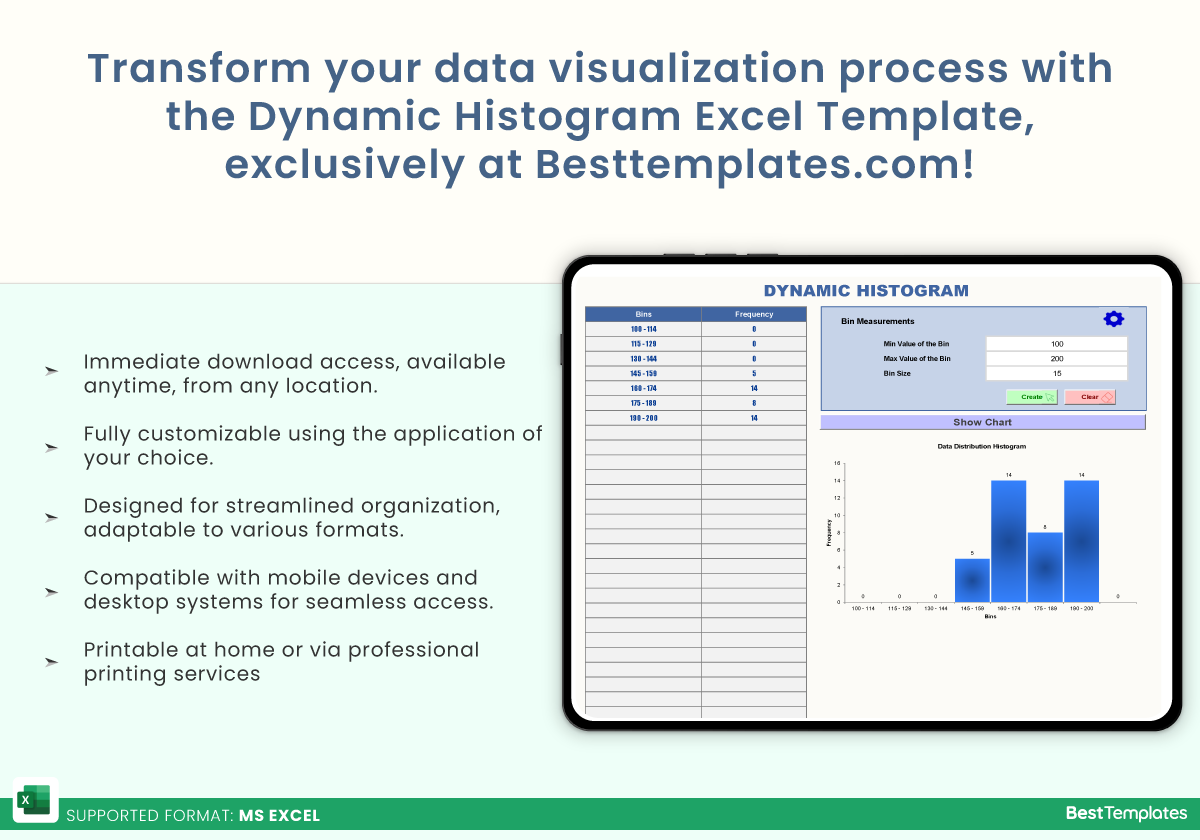
- Automated Updates: In the “Dynamic Histogram” sheet, input details in the Bin Measurements table and click “Create” to instantly update the Bins, Frequency table, and Histogram chart below.
- Quick Data Reset: Use the “Clear” button to instantly remove data from the table, allowing for a fresh start.
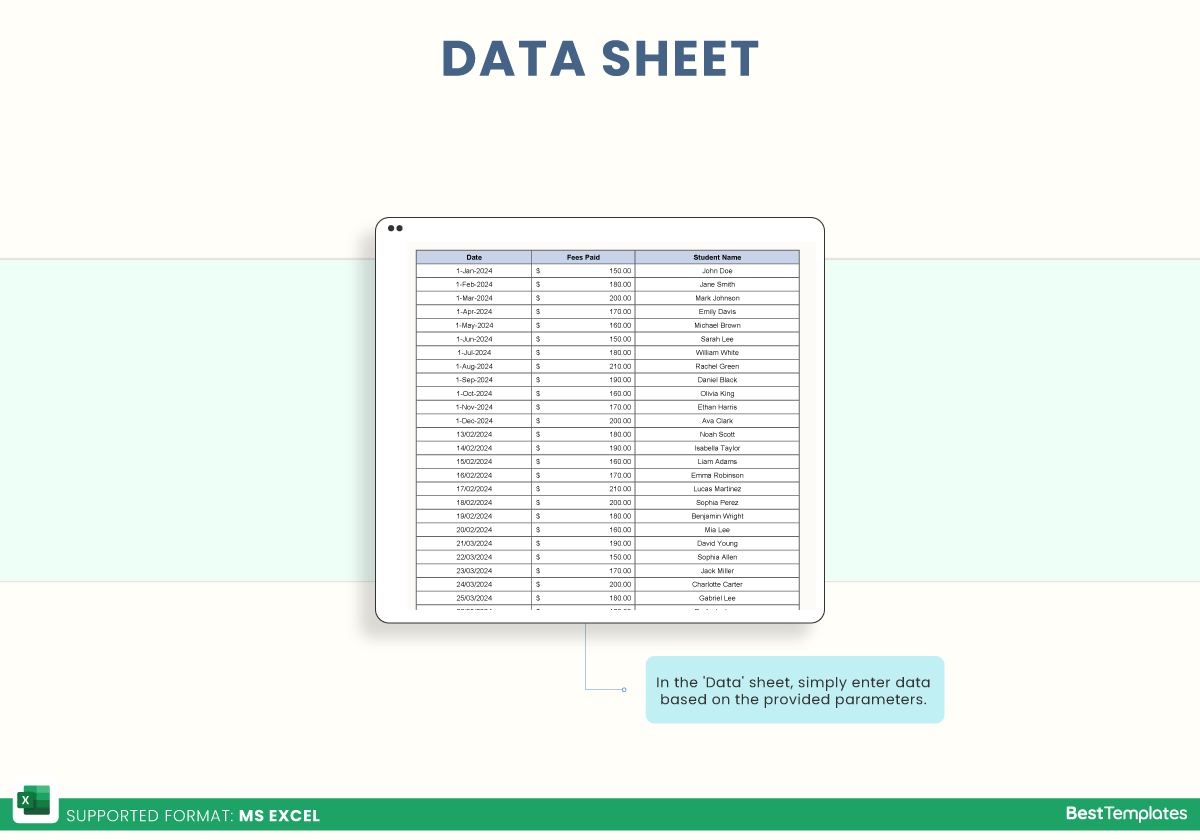
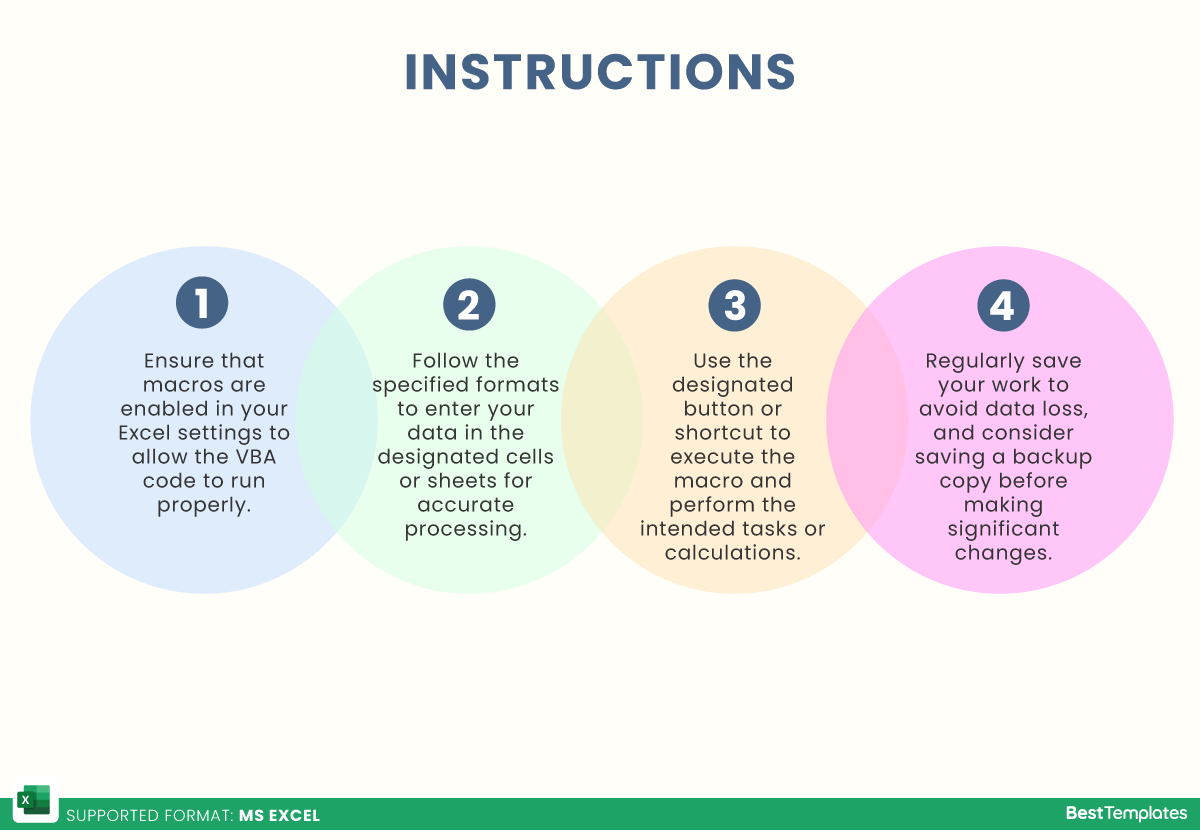
- Customizable Input Options: Input your required data on the “Data” sheet based on predefined parameters for seamless integration.
- User-Friendly Interface: Clean and professional design ensures easy navigation and suitability for presentations.
- Time-Saving Features: Streamline the creation of histograms without needing to manually adjust or calculate data.
Whether you’re conducting detailed analysis or presenting data to stakeholders, the Dynamic Histogram Excel Template from Besttemplates.com ensures accuracy and efficiency. Get this must-have tool today and elevate your data visualization process.
Additional Information
| Available Formats | MS Excel |
|---|
Additional Product Info
- Compatibility: Excel 2013, 2016, 2019, 2021, Office 365
- Functionality: Includes VBA Macros/Custom Scripts
- Orientation Options: Portrait/Landscape
- Color Mode: RGB Color Space
- License Type: Standard License
- Customization: Easily editable and customizable
- Font Style: Business standard fonts are used
- Digital Optimization: Optimized for digital use only
- Printing Suitability: Suitable for printing


 No products in the cart.