Doughnut Chart Excel Template
$9.00
Available in stock
Already have an account? Login
Add to cart| Available Formats | MS Excel |
|---|
Description
Doughnut Chart Excel Template – Besttemplates.com
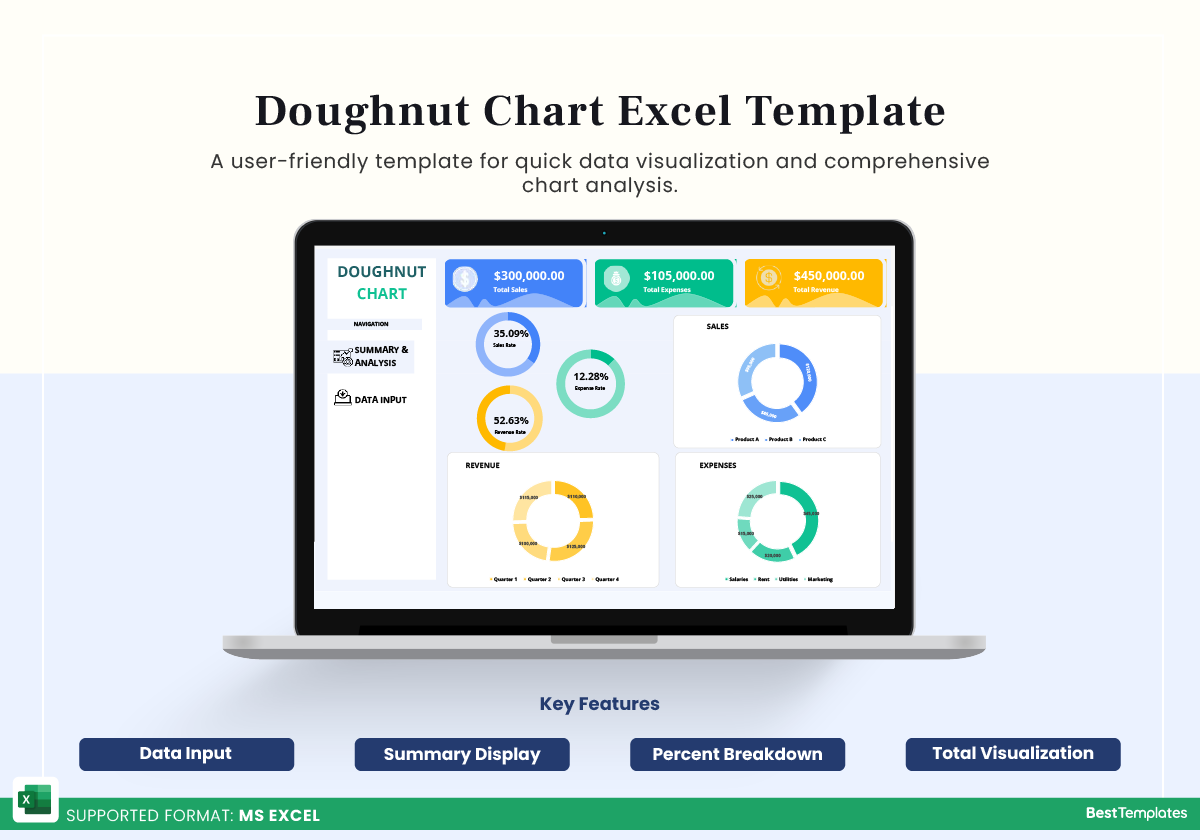
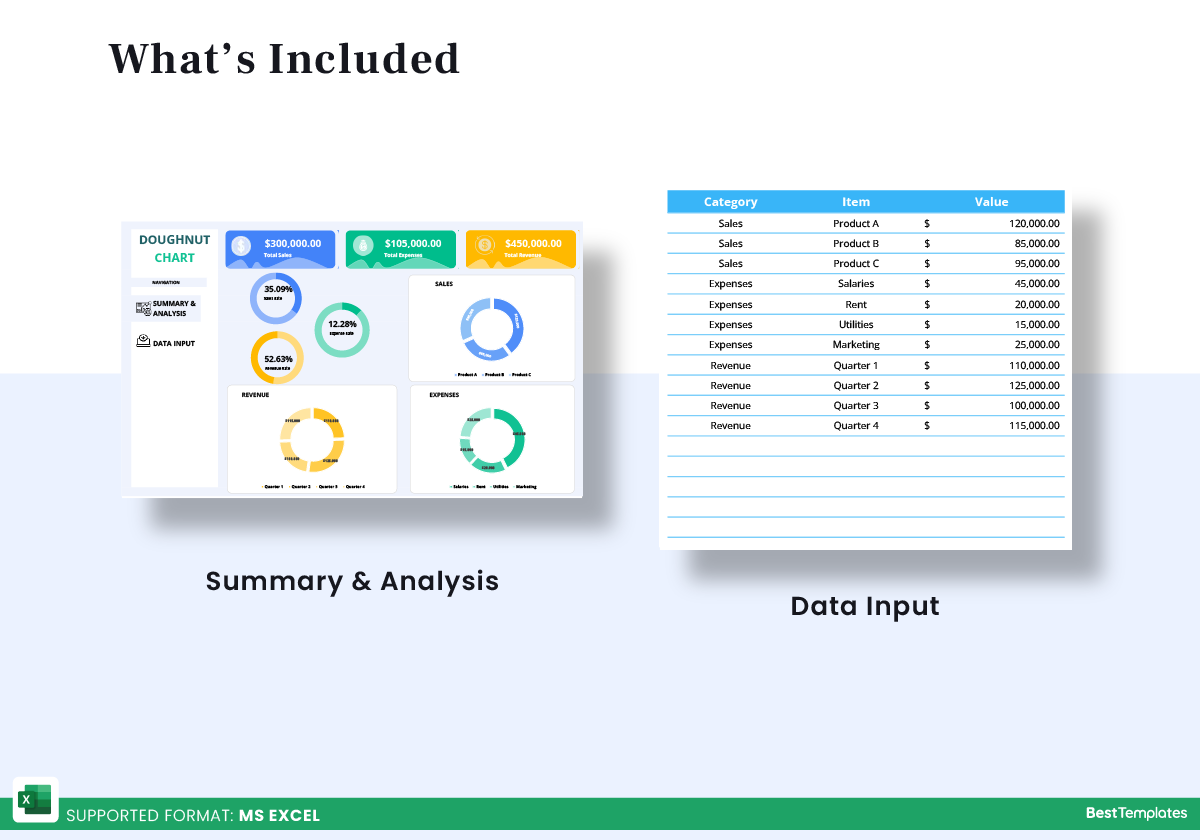
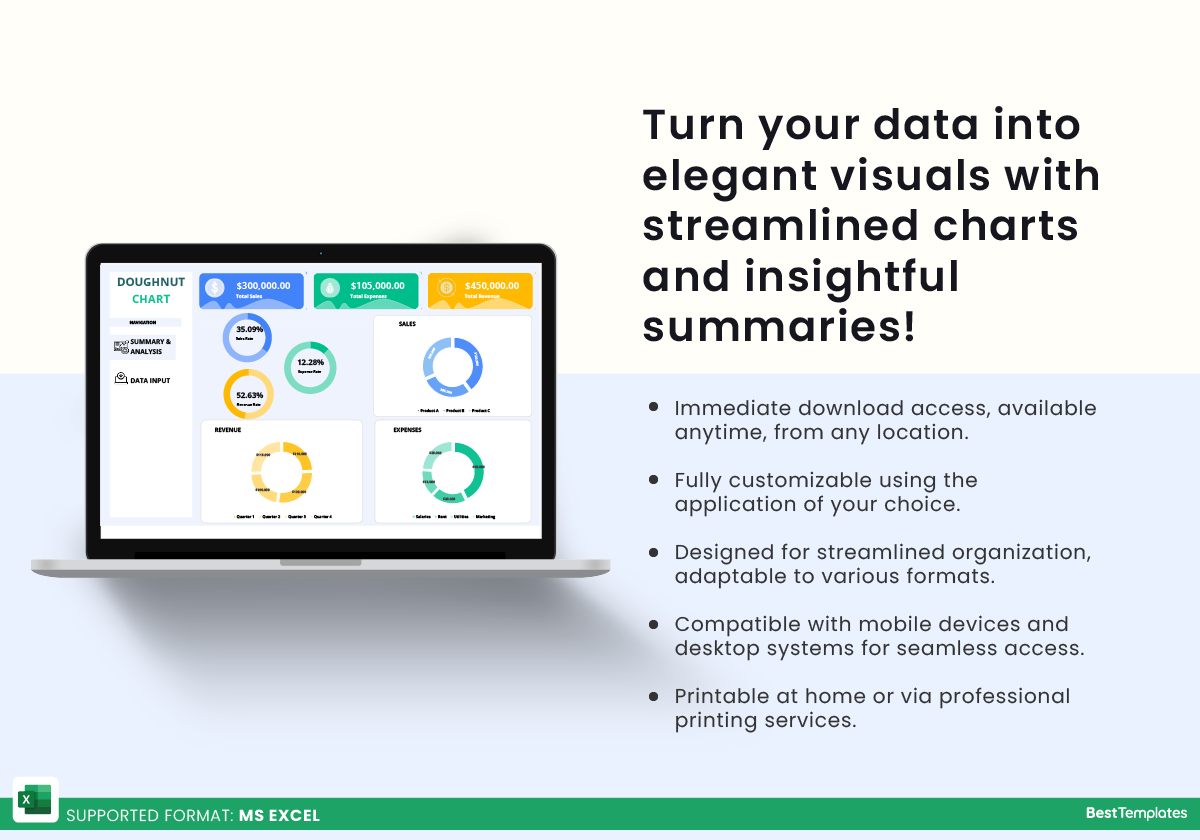
This Doughnut Chart Excel Template from Besttemplates.com is the perfect solution for visualizing data in a sleek, professional format. With its user-friendly layout, it’s designed for those who need an effective way to display and analyze categorical data in a visually engaging doughnut chart format. Begin by inputting data in the Data Input sheet, where you can organize information by categories and values. The template’s Summary and Analysis sheet then does the work of transforming this data into a beautifully designed doughnut chart, displaying percentages and totals for an at-a-glance understanding of data distribution.
Ideal for reports, presentations, or personal analysis, this template makes complex data easy to understand and visually appealing. Whether you’re working on sales, project tasks, budget distribution, or any data you need to analyze, this template from Besttemplates.com makes presenting information simpler and more effective.
Key Features:
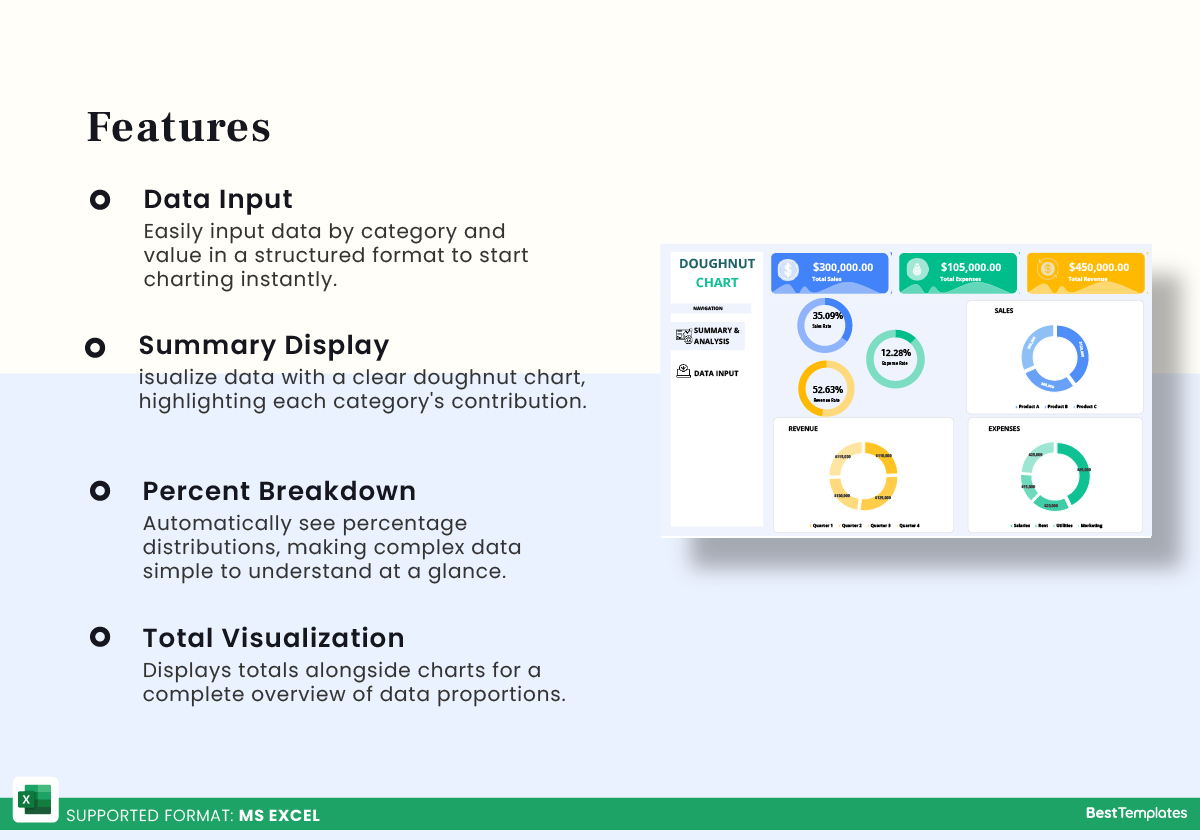
- Data Input sheet for easy data entry
- Summary and Analysis sheet with automated charting
- Percentage breakdowns for each category
- Totals display for clear analysis
With its clean design and intuitive setup, this Doughnut Chart Excel Template by Besttemplates.com is an essential tool for anyone looking to turn data into insights with minimal effort. It’s adaptable for various uses, ensuring you’ll have professional-quality visuals at your fingertips.
Additional Information
| Available Formats | MS Excel |
|---|
Additional Product Info
- Compatibility: Excel 2013, 2016, 2019, 2021, Office 365
- Functionality: No VBA Macros or custom scripts needed
- Orientation Options: Portrait/Landscape
- Color Mode: RGB Color Space
- License Type: Standard License
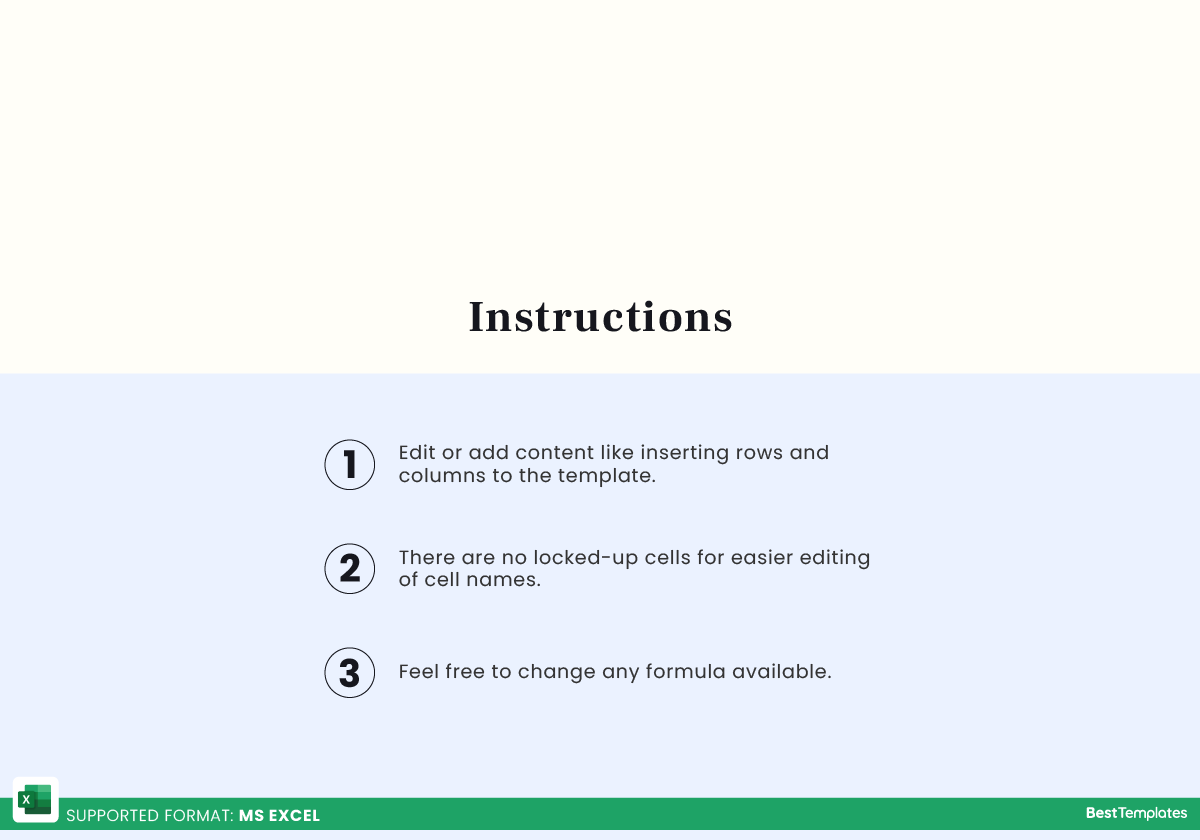
- Customization: Easily editable and customizable
- Font Style: Business standard fonts are used
- Digital Optimization: Optimized for digital use only
- Printing Suitability: Suitable for printing


 No products in the cart.