Dashboard Excel Template
$9.99
Available in stock
Already have an account? Login
Add to cart| Available Formats | MS Excel |
|---|
Description
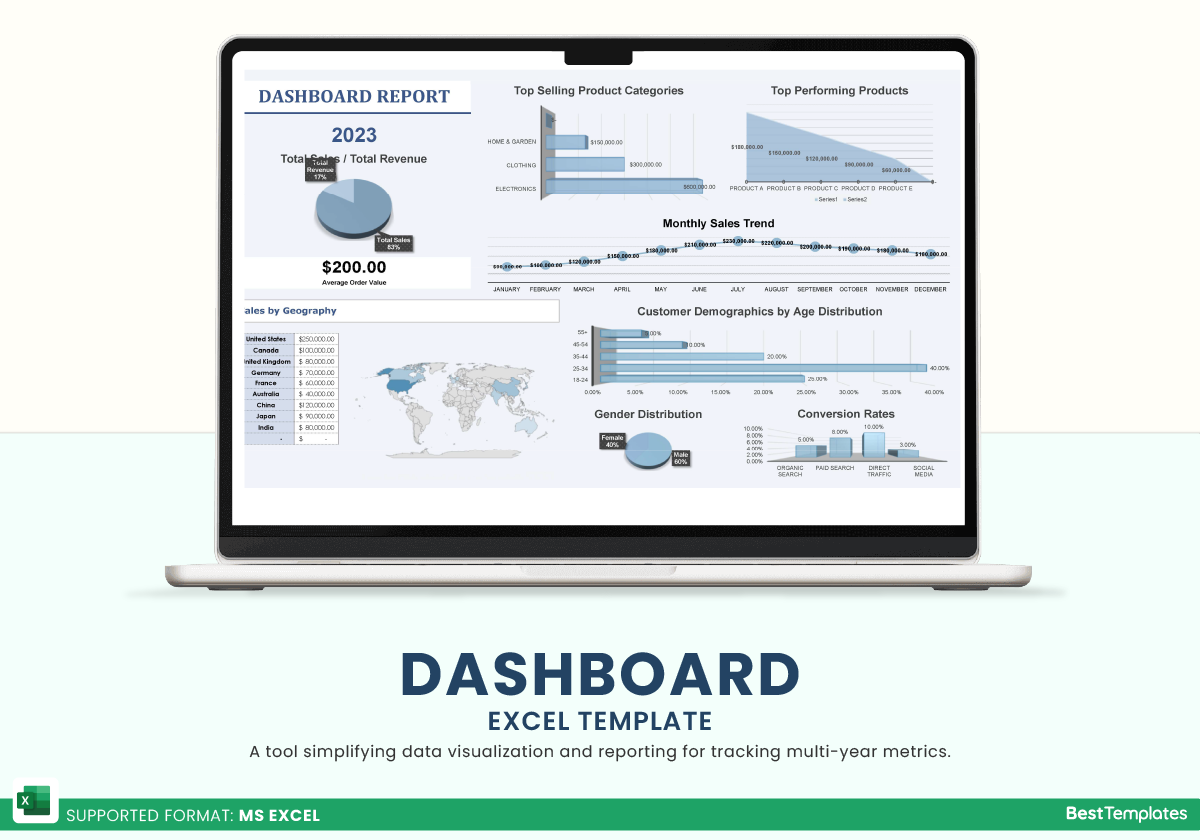
The Dashboard Excel Template from Besttemplates.com is a comprehensive tool designed to simplify data visualization and reporting for businesses. It allows users to log key data points across multiple years and easily generate insightful reports based on that data. With its user-friendly layout, the template empowers you to monitor your business performance and make informed decisions quickly. Whether you’re tracking sales, revenue, or customer demographics, this template enables clear, actionable analysis.
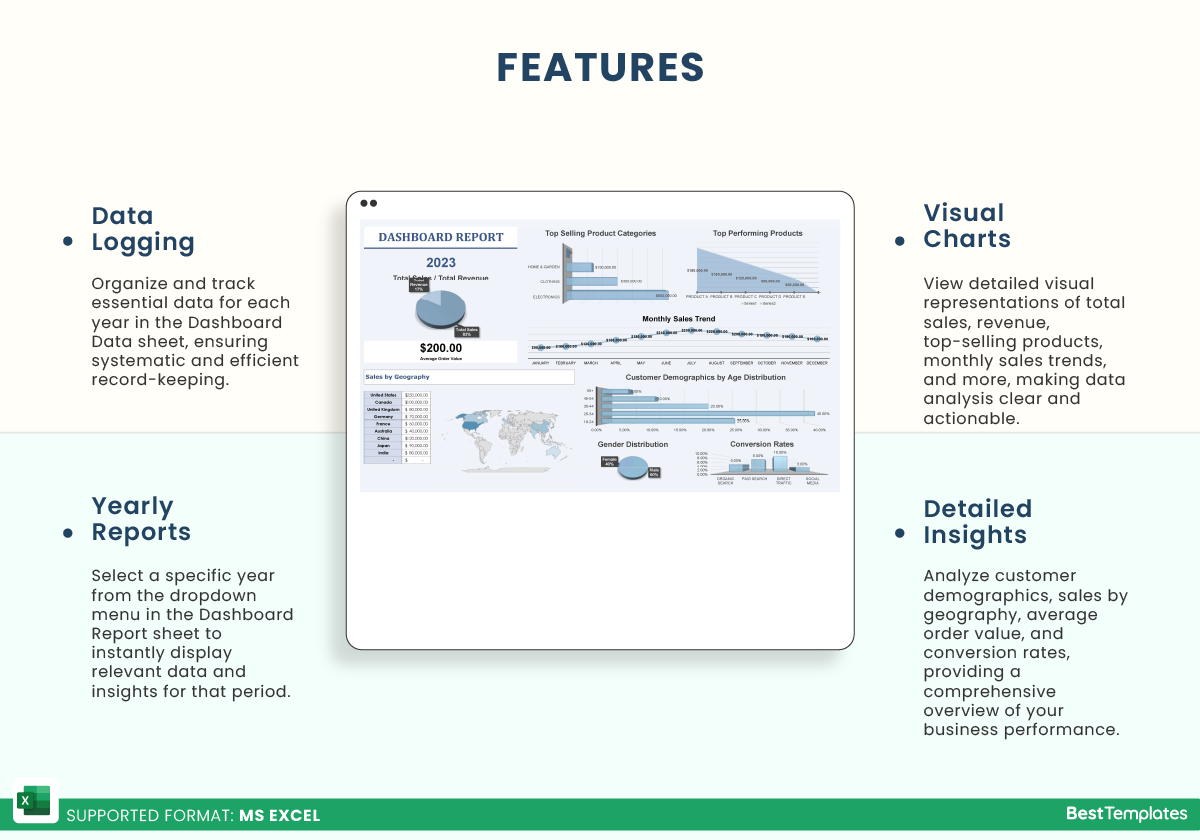
In the Dashboard Data sheet, you can log essential data for each year in designated columns, ensuring organized and systematic tracking. The Dashboard Report sheet allows you to select a specific year from the dropdown menu and instantly display all relevant data for that period. The report includes charts for total sales, revenue, top-selling products by category, monthly sales trends, sales by geography, customer demographics, and conversion rates. Additionally, users can view insights like average order value and sales by geography, all presented in clear, professional charts and graphs.
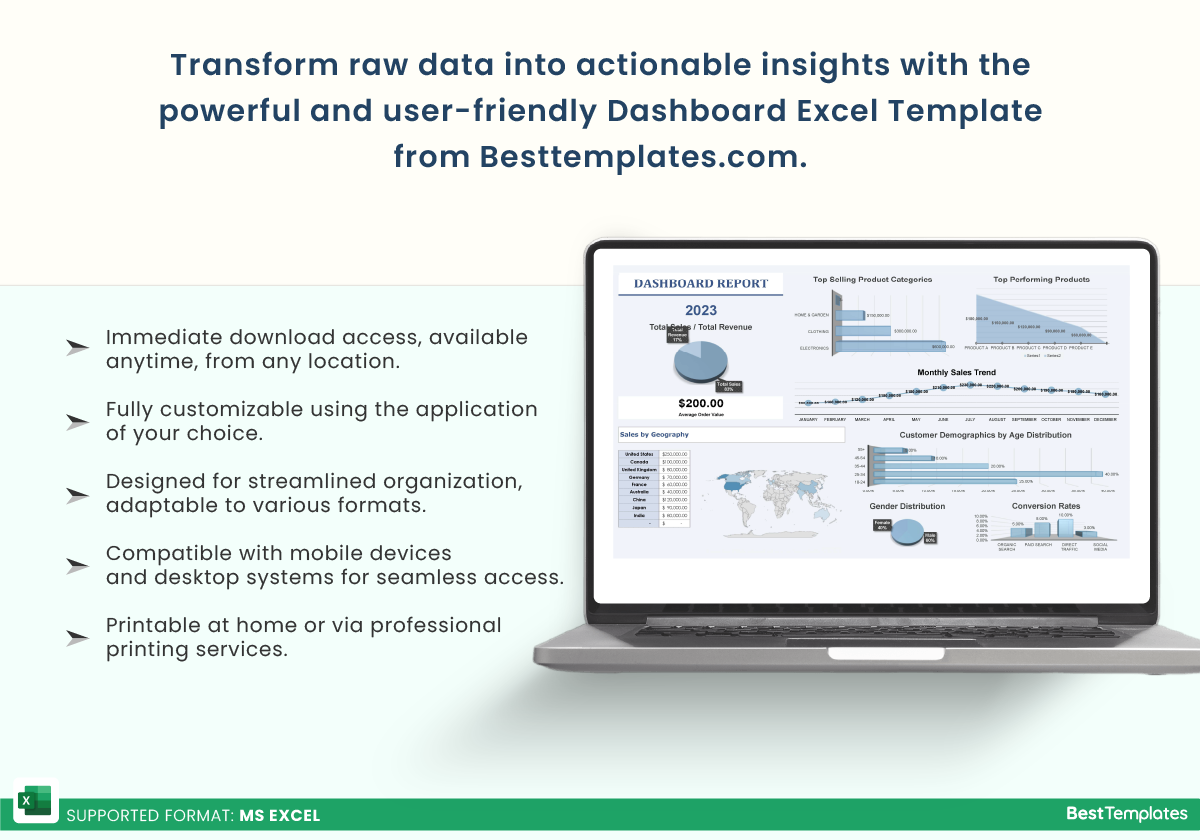
With this powerful template, businesses can streamline their data analysis process, transforming raw data into actionable insights with just a few clicks.
Key Features:
- Dashboard Data sheet to log annual data in designated columns.
- Dashboard Report sheet with a dropdown to select and display specific year data.
- Visual charts for total sales, revenue, top-selling products, and monthly sales trends.
- Detailed insights into sales by geography, customer demographics by age and gender, and conversion rates.
- Overview of average order value and regional sales distribution.
This Dashboard Excel Template from Besttemplates.com is a perfect solution for businesses looking to automate reporting, making complex data easier to digest and track over time. Improve your decision-making by accessing year-over-year insights at your fingertips.
Additional Information
| Available Formats | MS Excel |
|---|
Additional Product Info
- Compatibility: Excel 2021, Office 365
- Functionality: No VBA Macros or custom scripts needed
- Orientation Options: Portrait/Landscape
- Color Mode: RGB Color Space
- License Type: Standard License
- Customization: Easily editable and customizable
- Font Style: Business standard fonts are used
- Digital Optimization: Optimized for digital use only
- Printing Suitability: Suitable for printing

 No products in the cart.