


Comparison Chart Excel Template
$9.00
Available in stock
Already have an account? Login
Add to cart| Available Formats | MS Excel |
|---|
Description
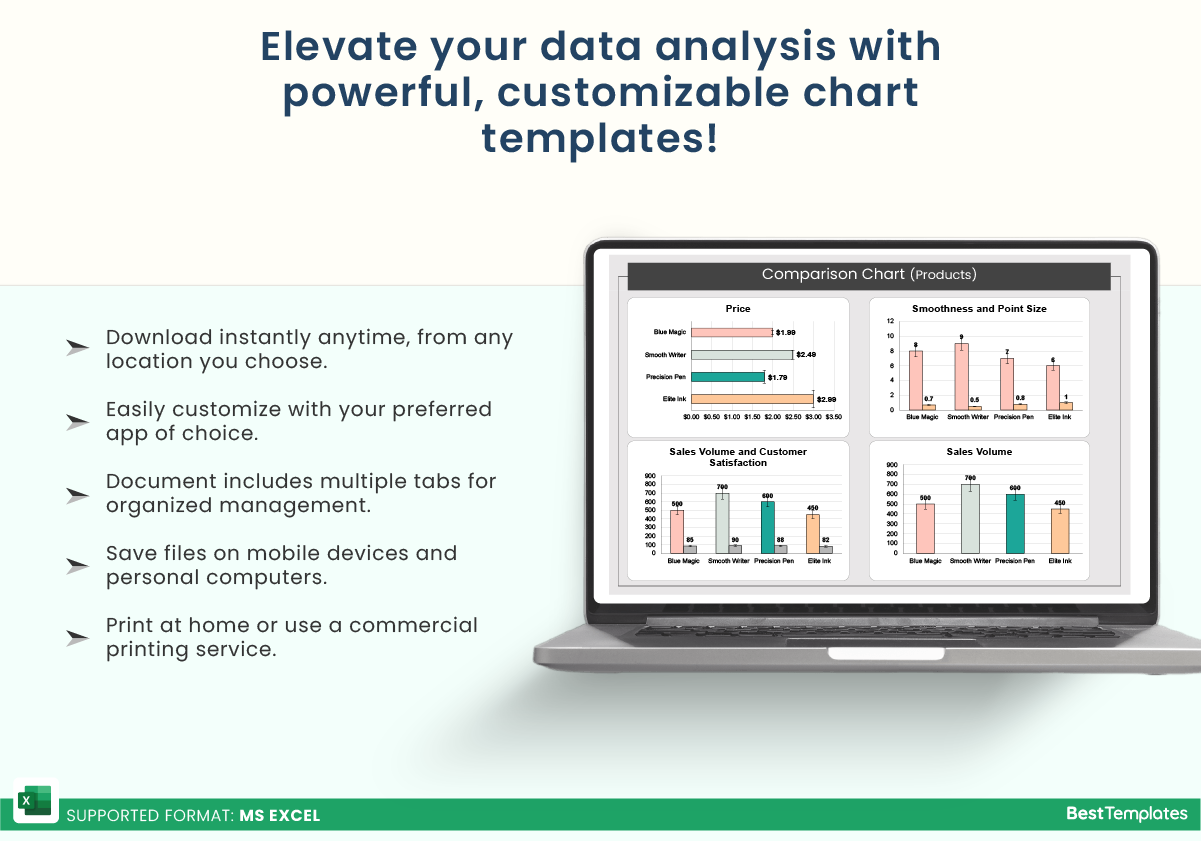
Looking for a powerful yet simple way to compare and visualize data? The Comparison Chart Excel Template from Besttemplates.com is the perfect solution for quickly organizing and comparing key metrics. This template is designed with a customizable “Data” sheet where you can input your specific data according to predefined parameters. Whether you’re comparing sales figures, project metrics, or performance across different departments, this template allows you to enter data with ease.
Once your data is added, the “Comparison Chart” sheet generates beautiful, clear charts that are connected directly to the “Data” sheet. This feature lets you instantly visualize how different data points compare with one another. Whether you’re looking to showcase trends, growth, or comparative performance, this template simplifies the process while giving you professional, easy-to-read visuals.
Key Features:
- Fully customizable “Data” sheet for streamlined data entry
- Automatically generated comparison charts for quick visualization
- Clear and concise visual representation of your data
- Ideal for comparing performance, financials, or project metrics
With the Comparison Chart Excel Template from Besttemplates.com, managing and comparing data has never been easier. This template saves you time while providing professional visuals that make your data easier to understand and present.
Additional Information
| Available Formats | MS Excel |
|---|
Additional Product Info
- Compatibility: Excel 2013, 2016, 2019, 2021, Office 365
- Functionality: No VBA Macros or custom scripts needed
- Orientation Options: Portrait/Landscape
- Color Mode: RGB Color Space
- License Type: Standard License
- Customization: Easily editable and customizable
- Font Style: Business standard fonts are used
- Digital Optimization: Optimized for digital use only
- Printing Suitability: Suitable for printing


 No products in the cart.