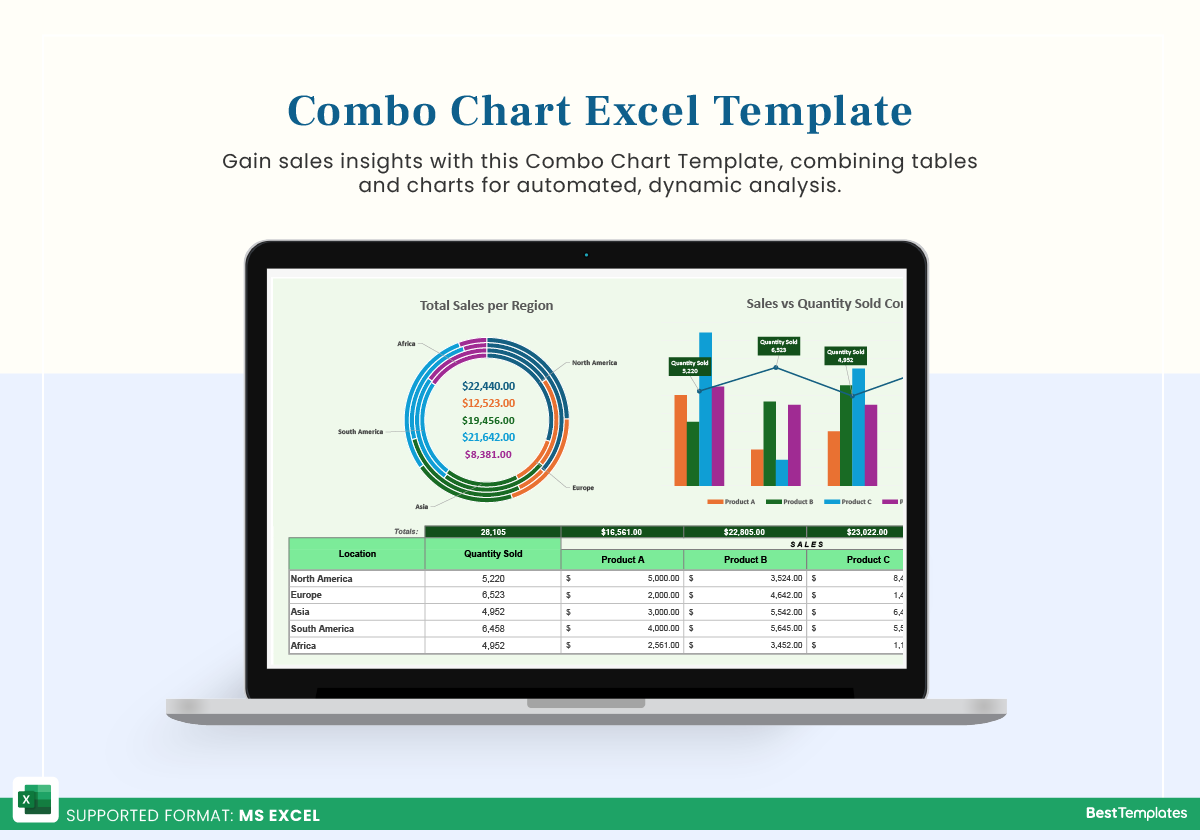
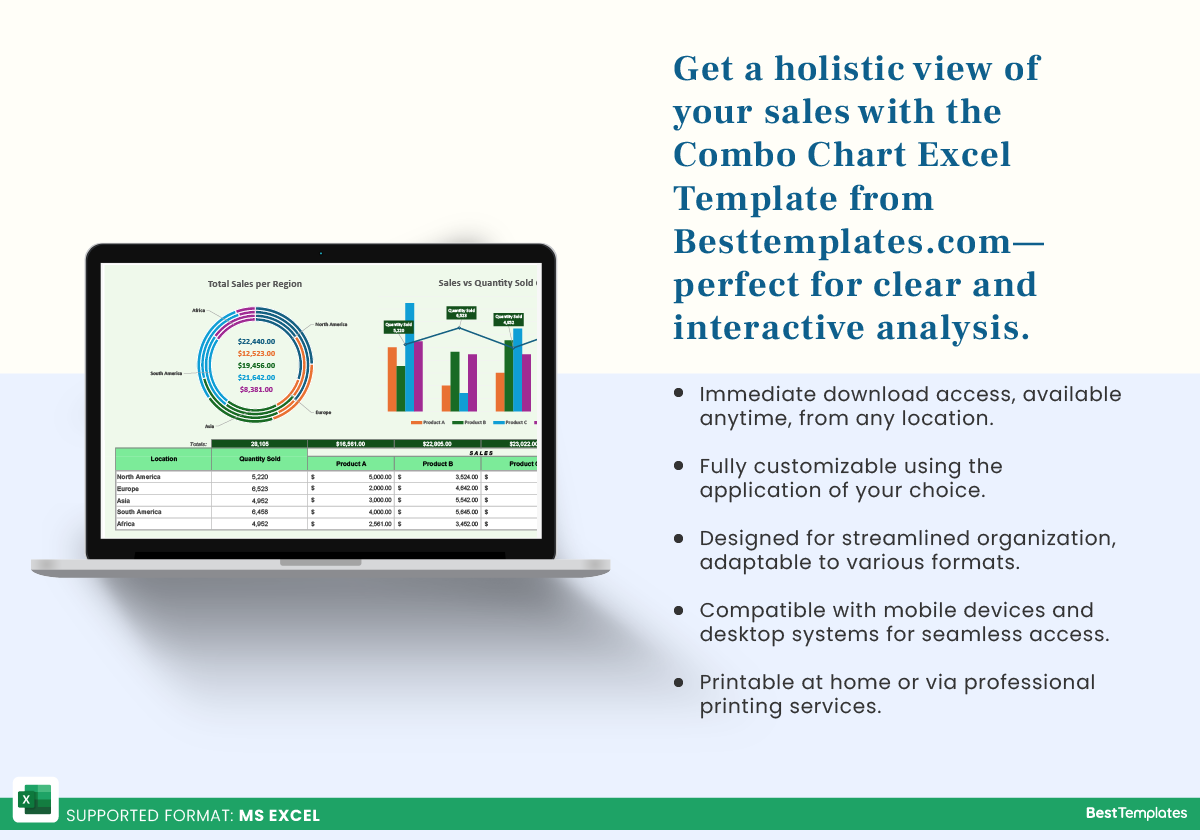
Elevate your data tracking and visualization with the Combo Chart Excel Template from Besttemplates.com. This all-in-one solution is tailored for sales professionals and business analysts, allowing for clear tracking of product performance across regions with engaging visuals and effortless data entry. Perfect for comparing metrics like quantity sold and revenue per product, this template enhances strategic decision-making with its easy-to-read charts and automated calculations.
Key Features:
- Product Sales Input – Easily enter product names along with quantity sold and revenue figures to generate a comprehensive overview of sales performance.
- Formulated Total Row – Automatically computes total sales for each product, providing a quick, reliable summary above the data table.
- Dynamic Pie Charts – Automatically updating dual pie charts highlight total sales by region, complete with labeled segments showing each region’s contribution.
- Interactive Combo Chart – Offers a visual comparison of total sales per product alongside regional sales quantities, providing a dual perspective on performance metrics.


 No products in the cart.