Chart Excel Template
$9.00
Available in stock
Already have an account? Login
Add to cart| Available Formats | MS Excel |
|---|
Description
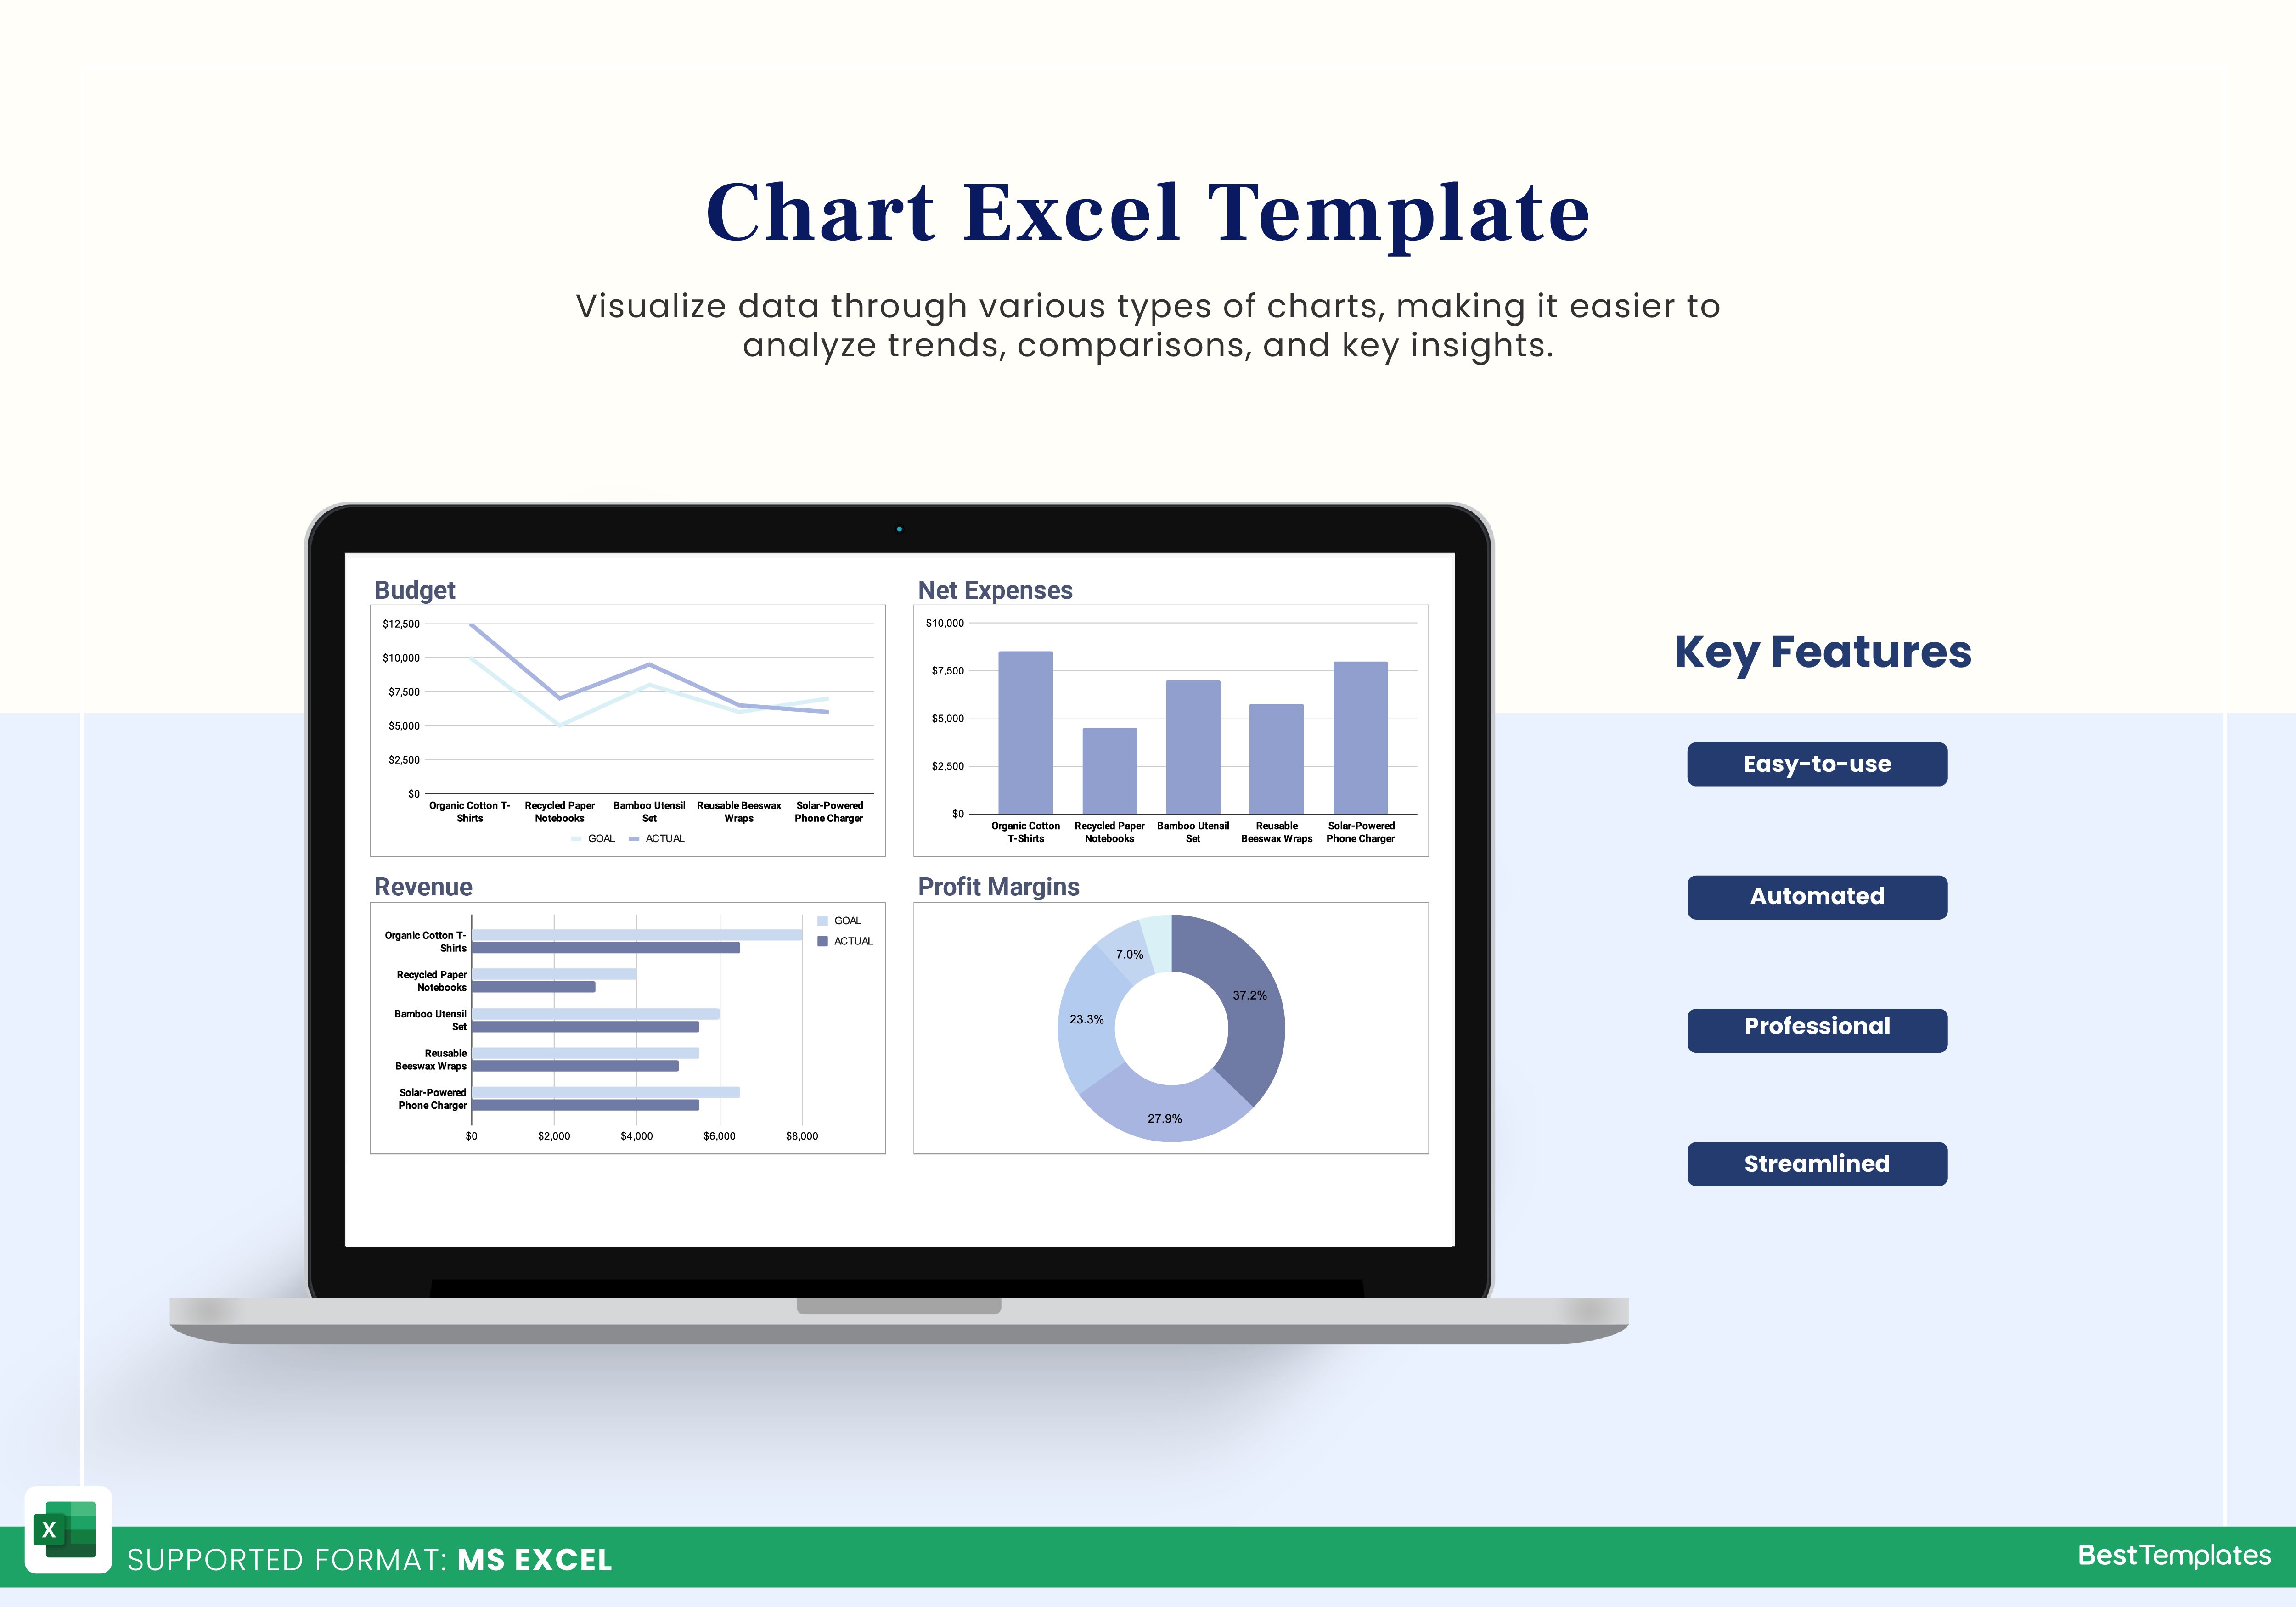
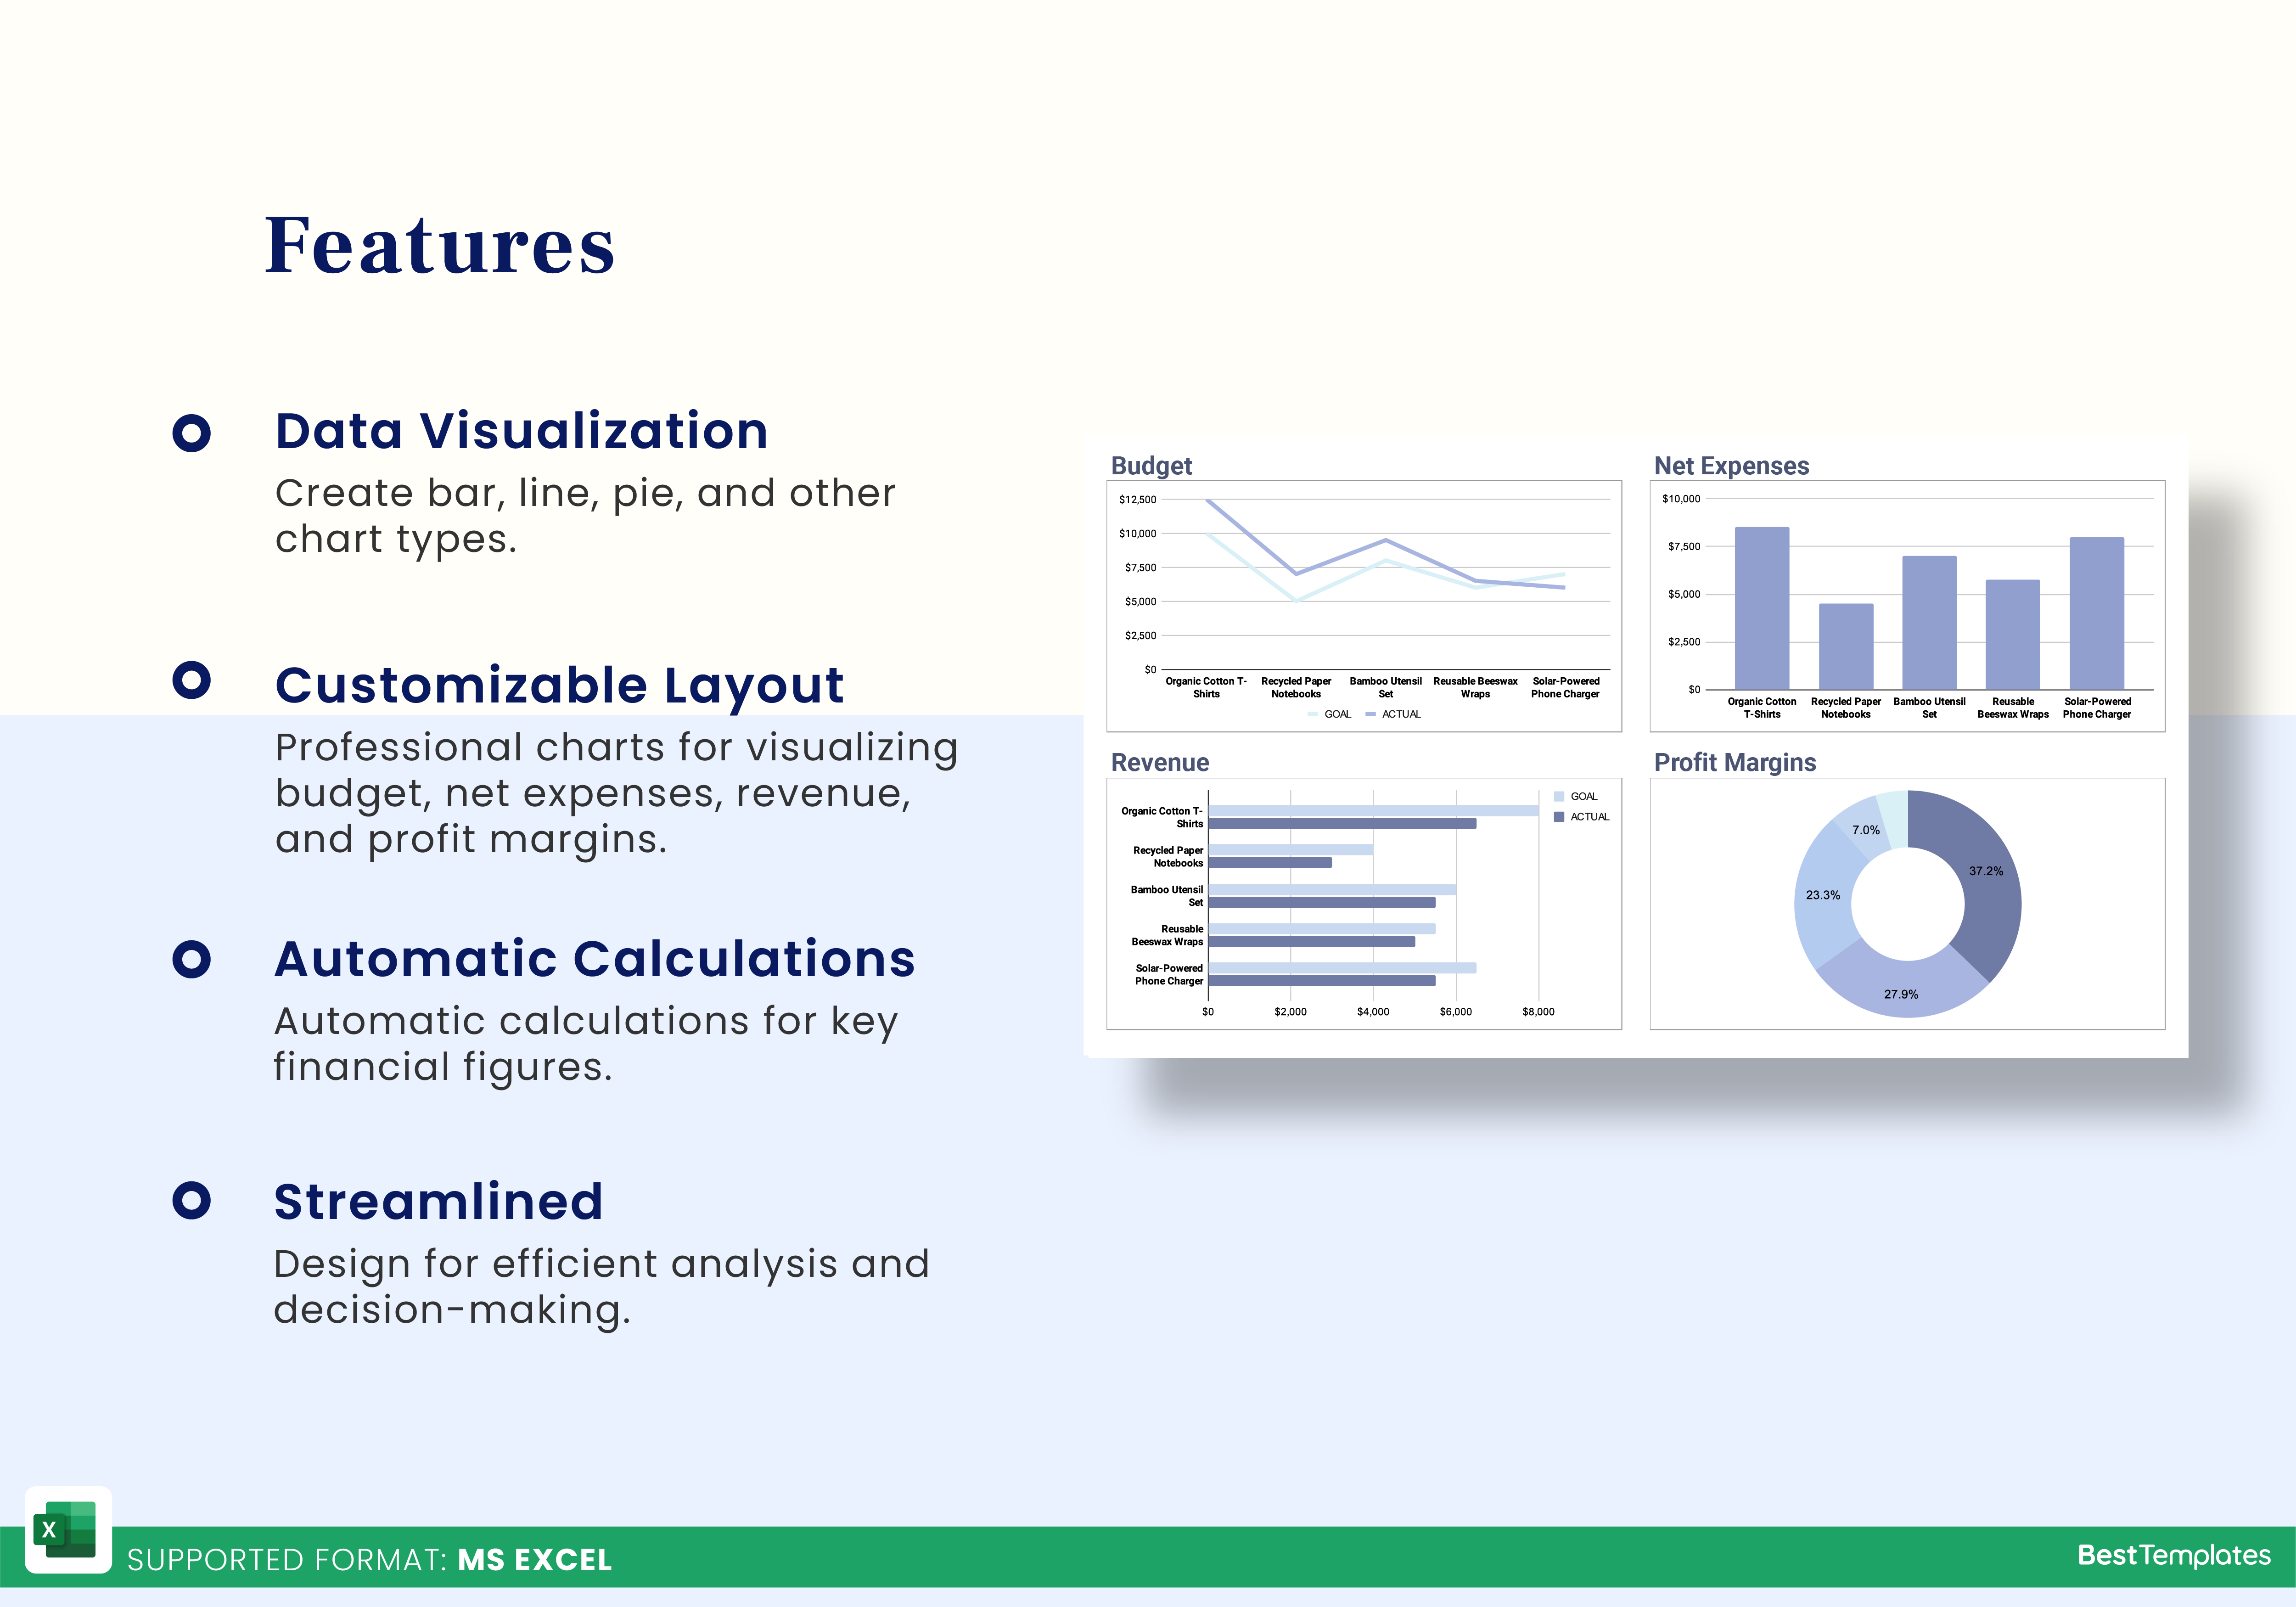
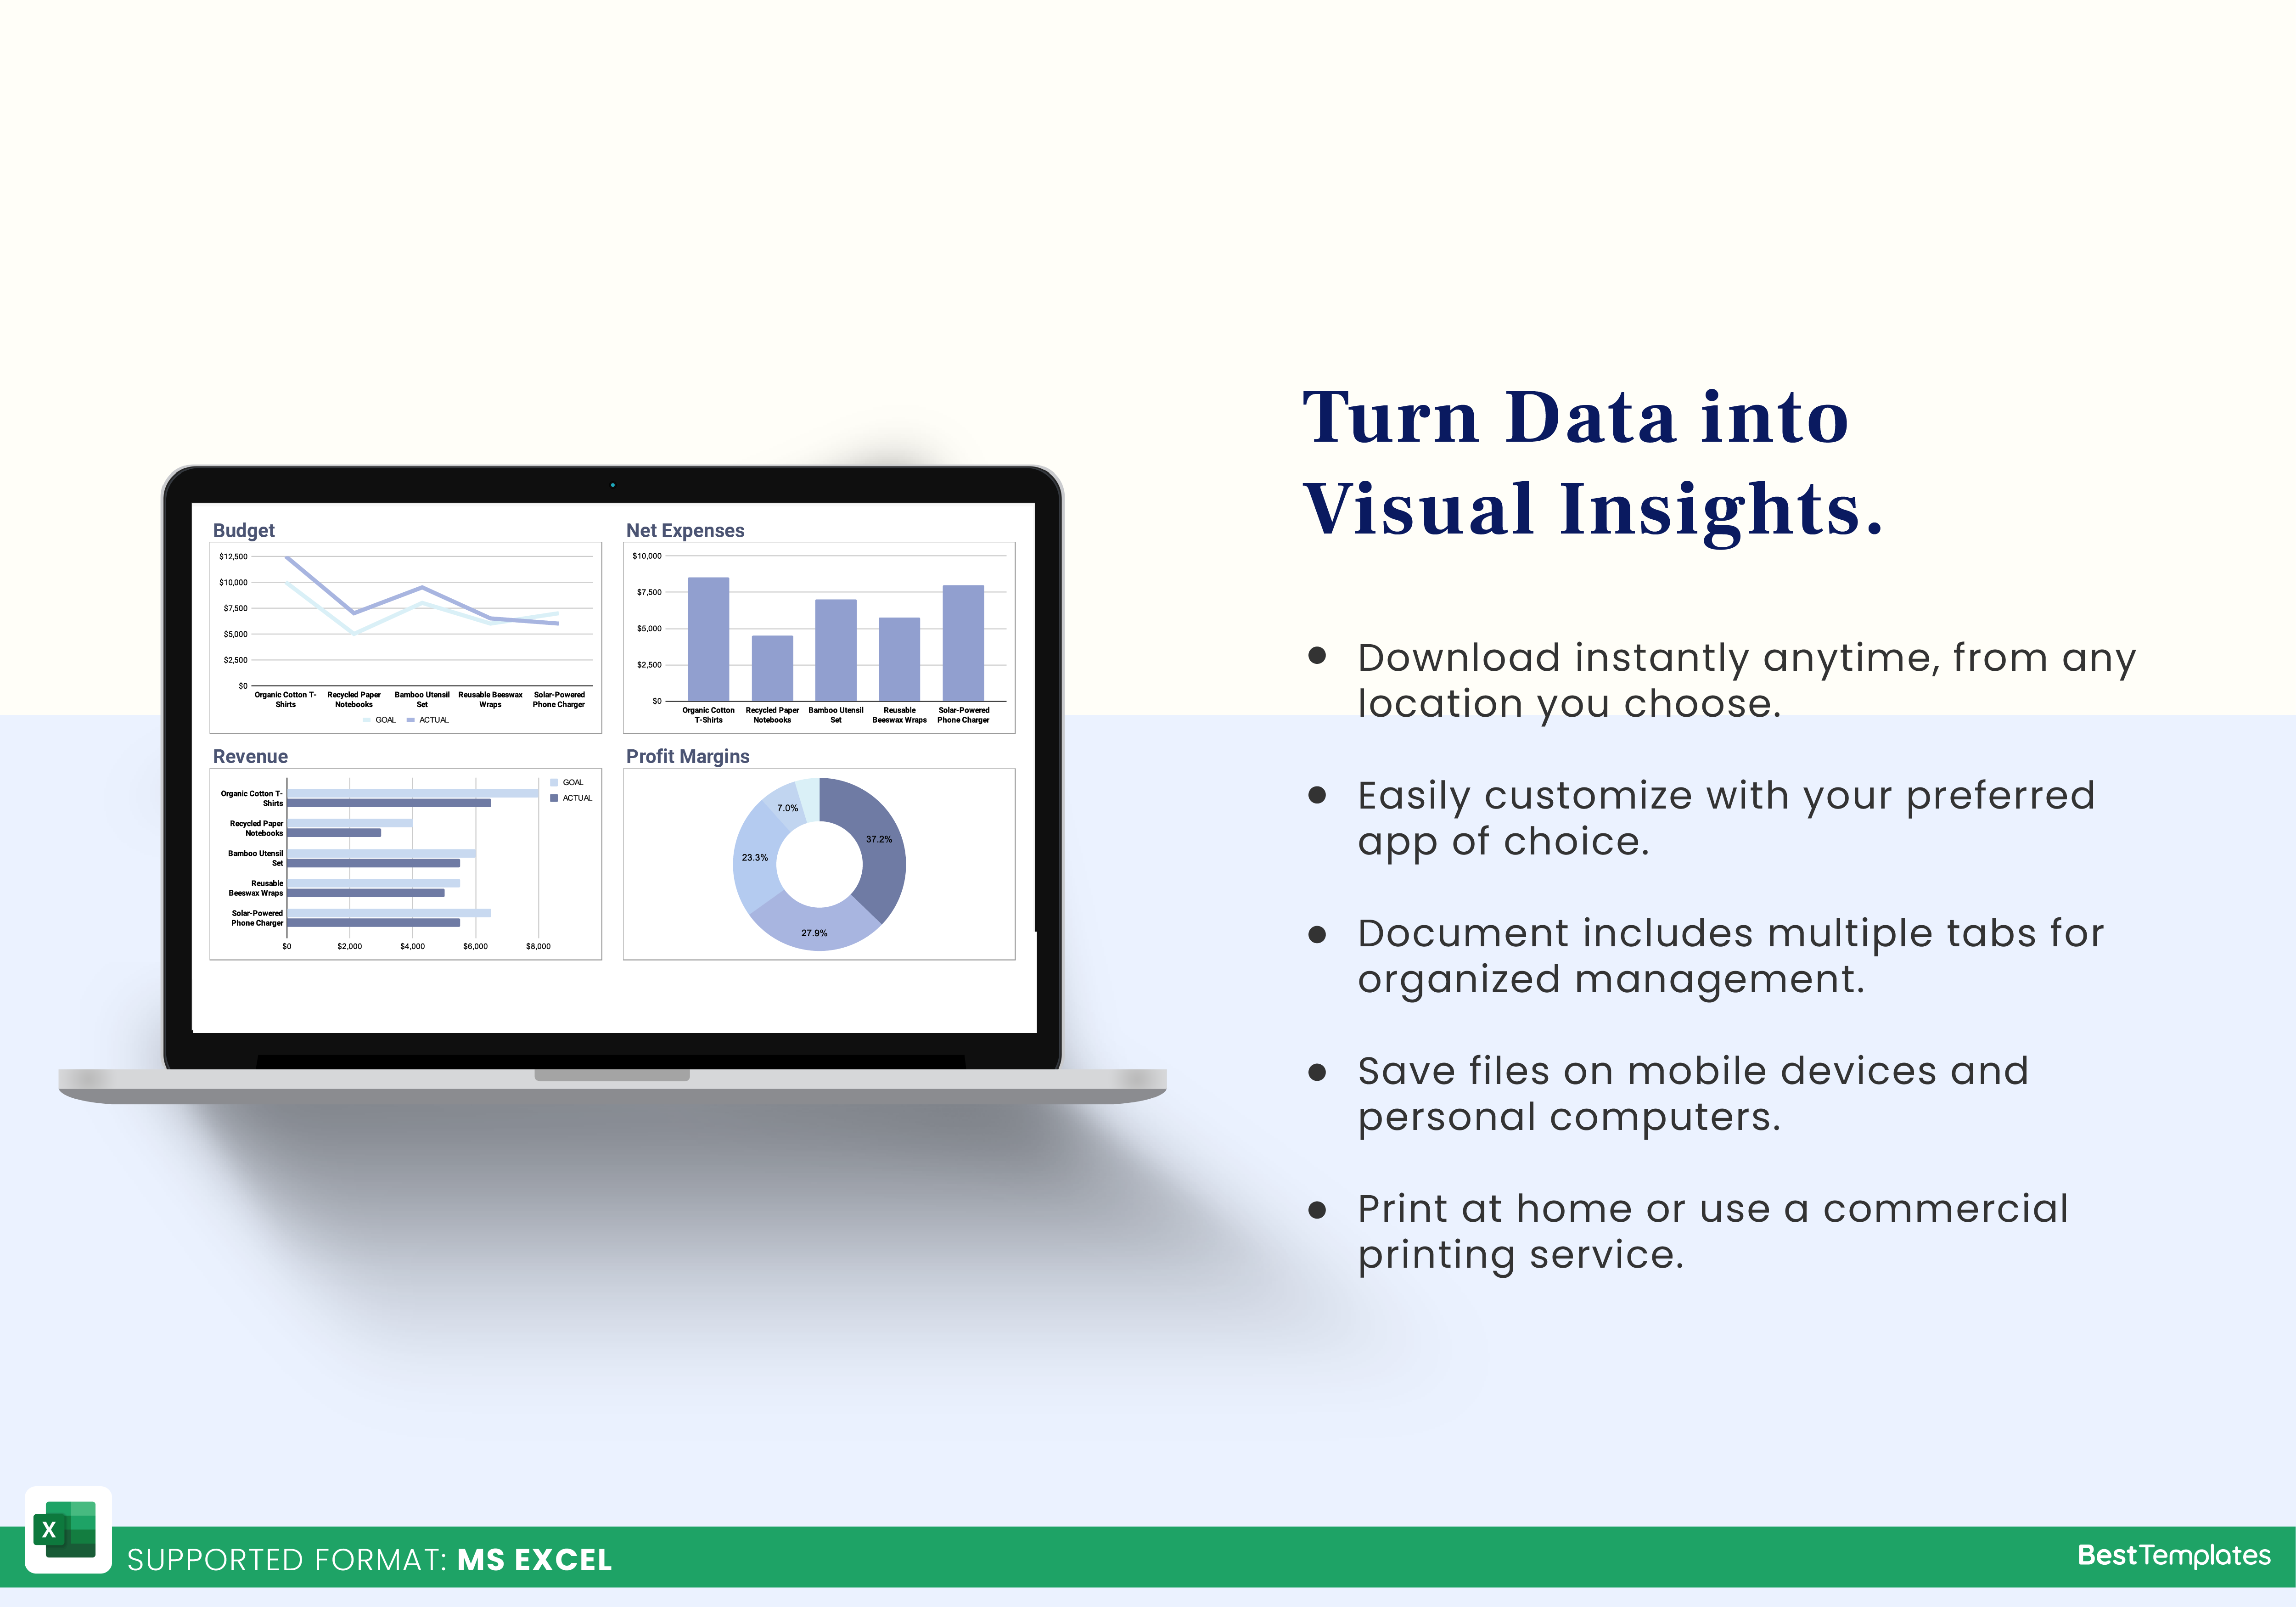
Elevate your data presentation with the Chart Excel Template from Besttemplates.com. This user-friendly template is designed to simplify the process of visualizing complex financial data, making it an essential tool for analysts, marketers, and business owners alike. In the “Data” sheet, simply enter your necessary data based on the provided parameters. The template is intelligently designed, with key figures bolded and automatically calculated—just be sure not to edit these numbers. Transitioning to the “Chart” sheet, you’ll find stunning visual representations of your budget, net expenses, revenue, and profit margins. These charts not only enhance your reports but also provide valuable insights at a glance, allowing for quick and informed decision-making.
Key Features:
- Easy-to-use data entry in the “Data” sheet
- Automatic calculations for key financial figures
- Professional charts for visualizing budget, net expenses, revenue, and profit margins
- Ideal for presentations and financial reporting
- Streamlined design for efficient analysis and decision-making
With the Chart Excel Template from Besttemplates.com, transform your data into compelling visuals that drive your business forward.
Additional Information
| Available Formats | MS Excel |
|---|
Additional Product Info
- Compatibility: Excel 2013, 2016, 2019, 2021, Office 365
- Functionality: No VBA Macros or custom scripts needed
- Orientation Options: Portrait/Landscape
- Color Mode: RGB Color Space
- License Type: Standard License
- Customization: Easily editable and customizable
- Font Style: Business standard fonts are used
- Digital Optimization: Optimized for digital use only
- Printing Suitability: Suitable for printing


 No products in the cart.