Cash Flow Chart Excel Template
$9.00
Available in stock
Already have an account? Login
Add to cart| Available Formats | MS Excel |
|---|
Description
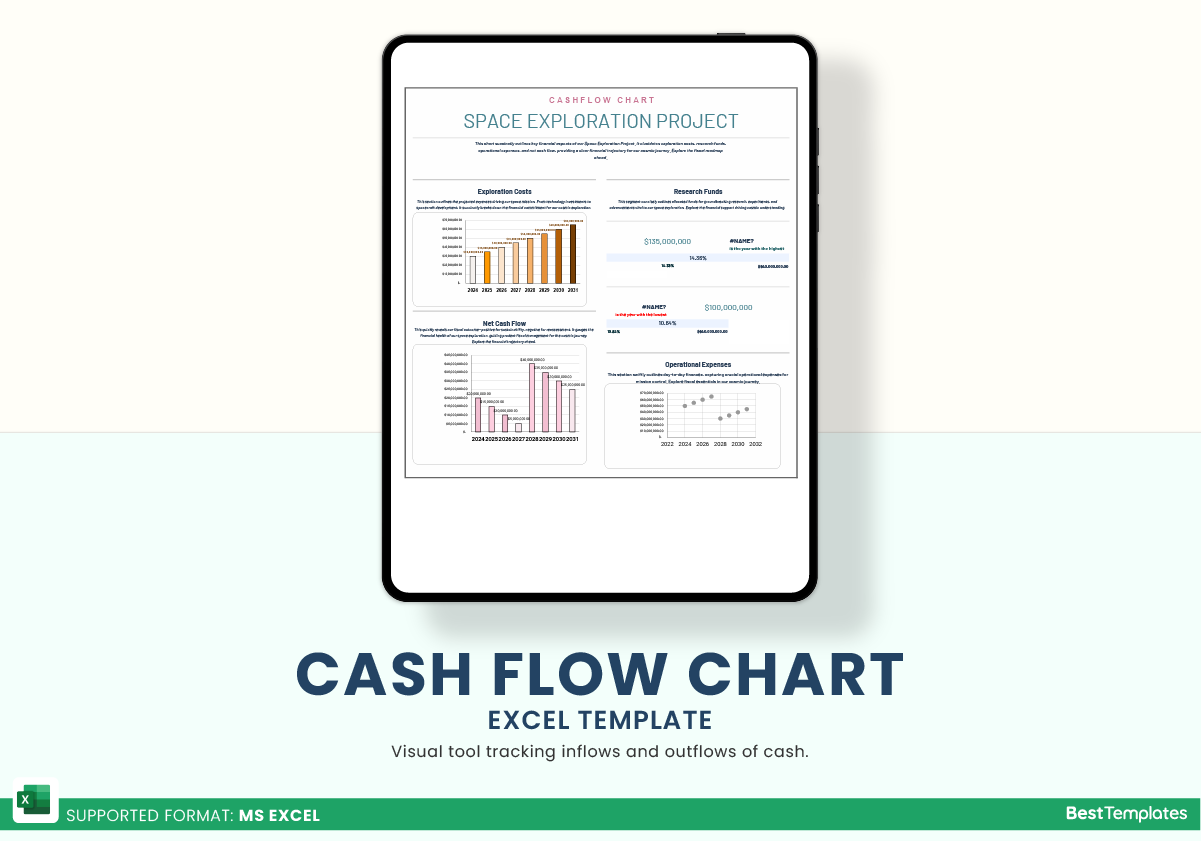
Our Cash Flow Chart Excel Template at Besttemplates.com is a powerful, user-friendly tool designed to streamline the process of tracking and analyzing cash flow. The template features a well-organized system that gathers critical financial data and displays it in an easy-to-read format. Whether you’re a small business owner or a financial analyst, this template can help you visualize your cash flow trends, make informed decisions, and maintain financial stability.
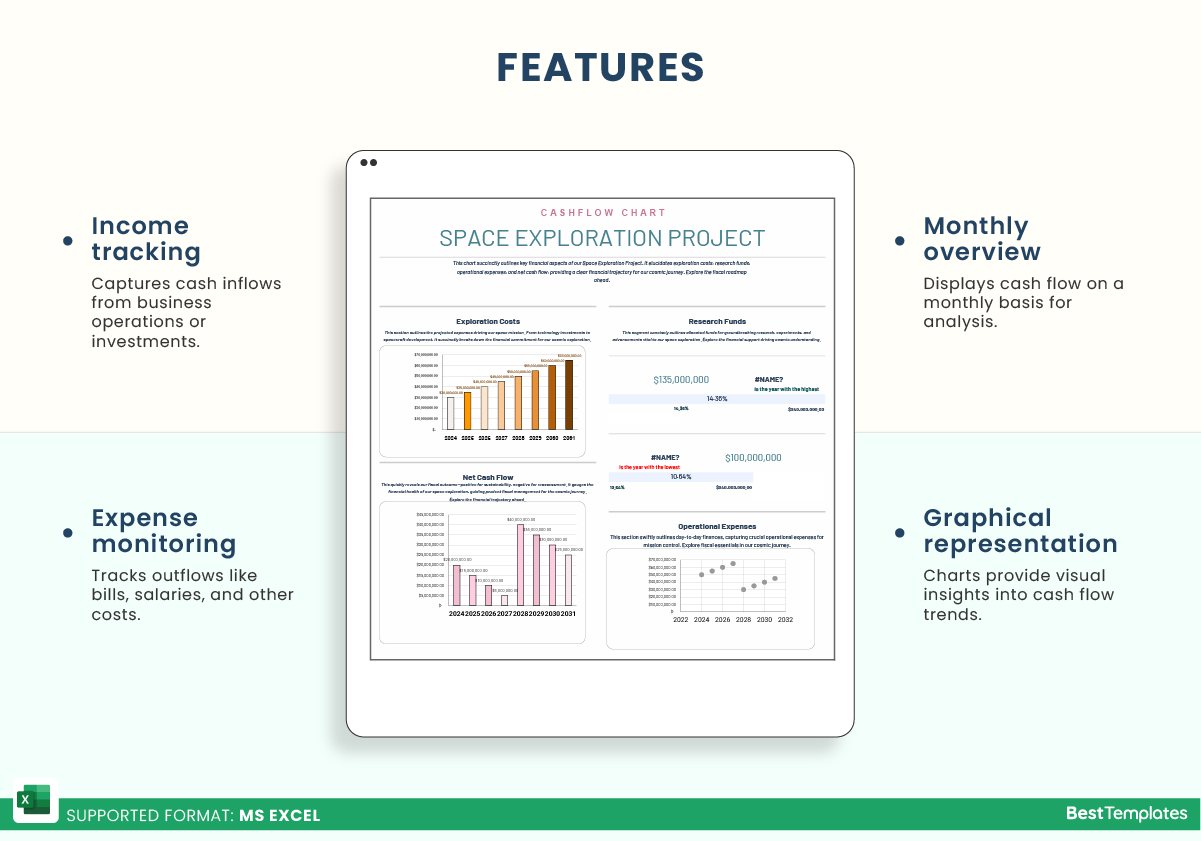
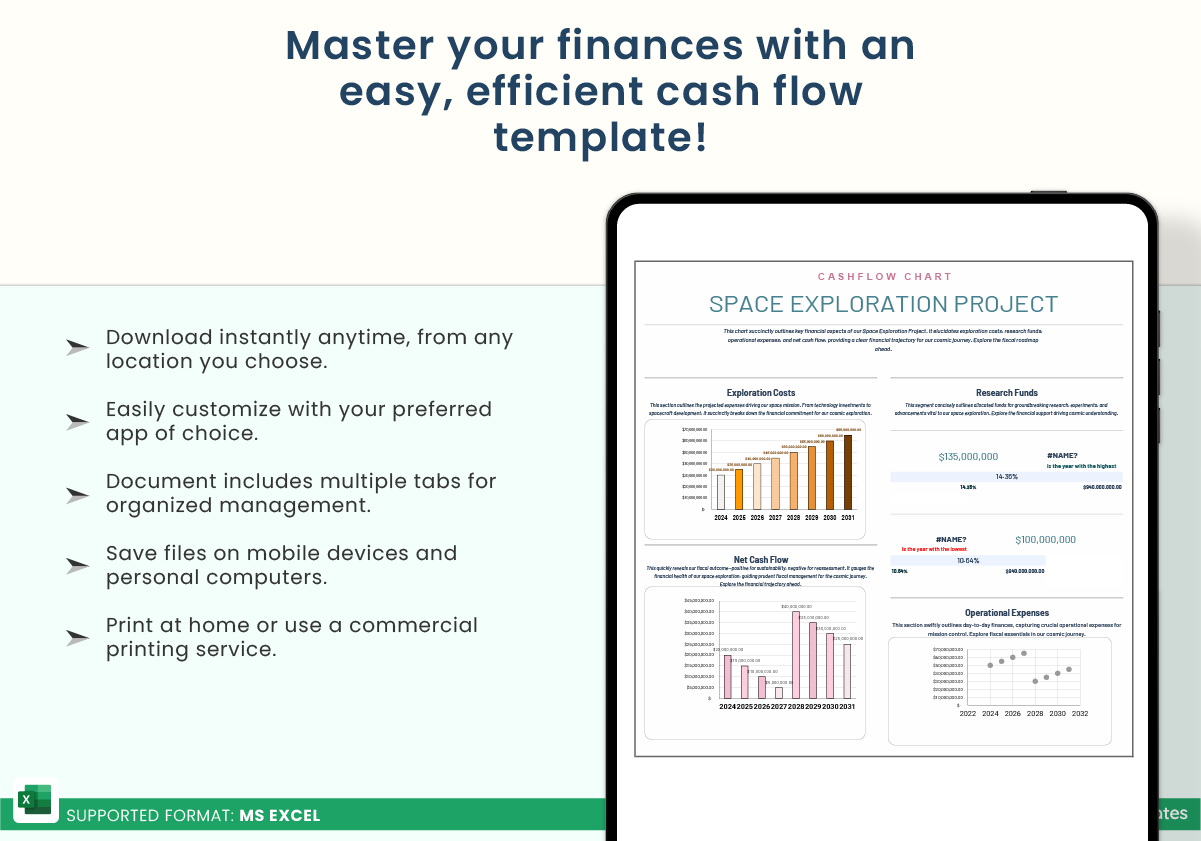
In the main “Chart” sheet, all calculations and charts are fully automated, drawing data directly from the “Data” sheet. This ensures seamless updates as you enter your financial information, providing an accurate and comprehensive view of your business’s cash flow. The visual elements, including progress bars, key metrics, and charts, make it simple to spot trends and make adjustments to optimize your financial strategy.
Key Features
- Fully formulated “Chart” sheet that pulls data from the “Data” sheet.
- Visual components like charts and progress bars for quick insights.
- Key financial metrics displayed in an easy-to-understand layout.
- Automatic updates based on data input for up-to-date analysis.
- Ideal for small businesses and financial professionals.
This Cash Flow Chart Excel Template from Besttemplates.com is the perfect tool for anyone looking to enhance their financial planning and cash flow analysis. It’s simple, intuitive, and designed to save time while providing critical financial insights.
Additional Information
| Available Formats | MS Excel |
|---|
Additional Product Info
- Compatibility: Excel 2021, Office 365
- Functionality: No VBA Macros or custom scripts needed
- Orientation Options: Portrait/Landscape
- Color Mode: RGB Color Space
- License Type: Standard License
- Customization: Easily editable and customizable
- Font Style: Business standard fonts are used
- Digital Optimization: Optimized for digital use only
- Printing Suitability: Suitable for printing




 No products in the cart.