Bubble Chart Excel Template
$9.00
Available in stock
Already have an account? Login
Add to cart| Available Formats | MS Excel |
|---|
Description
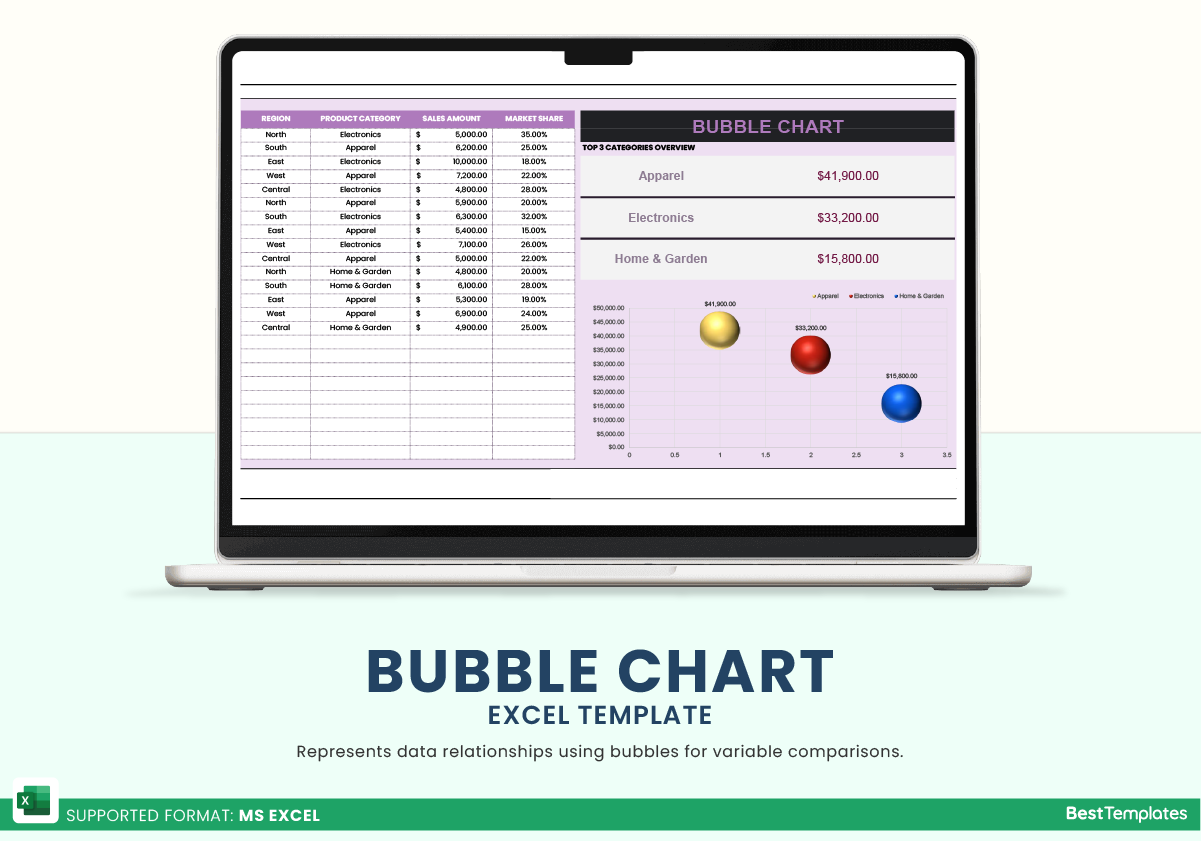
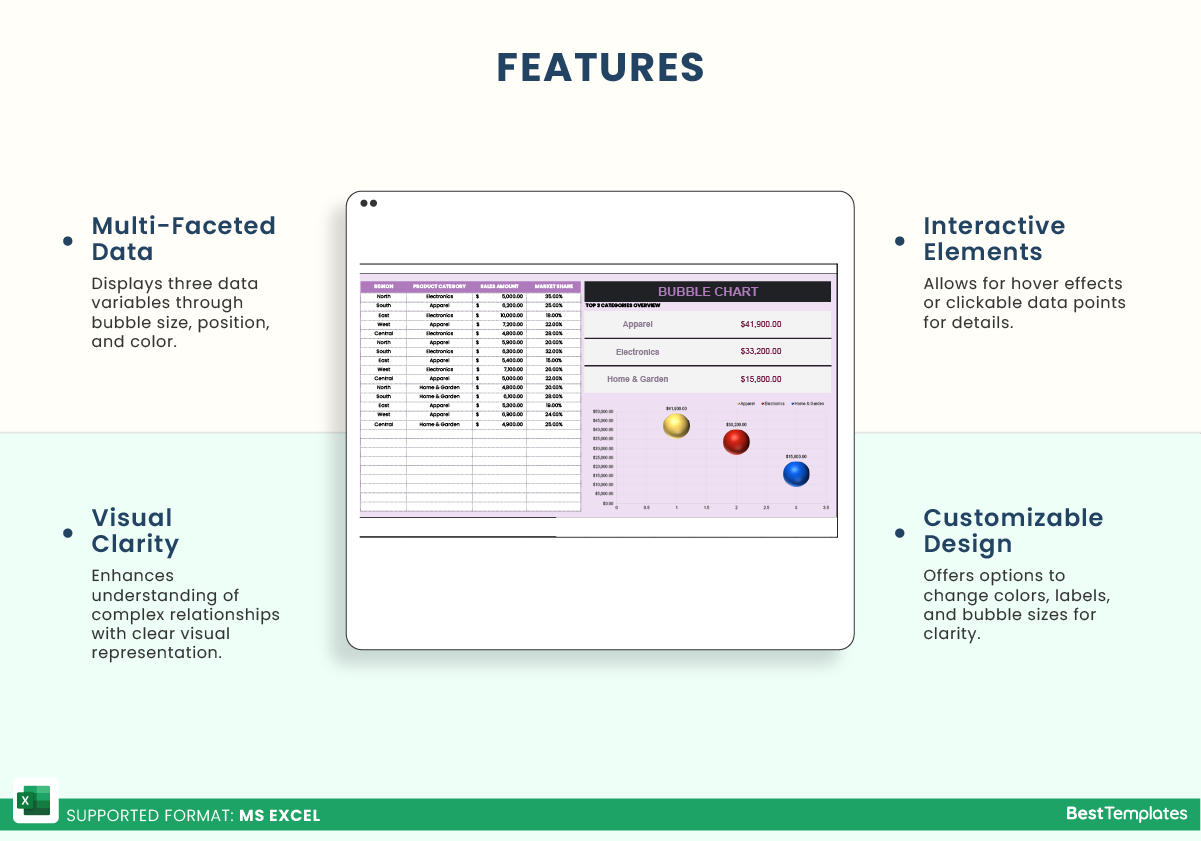
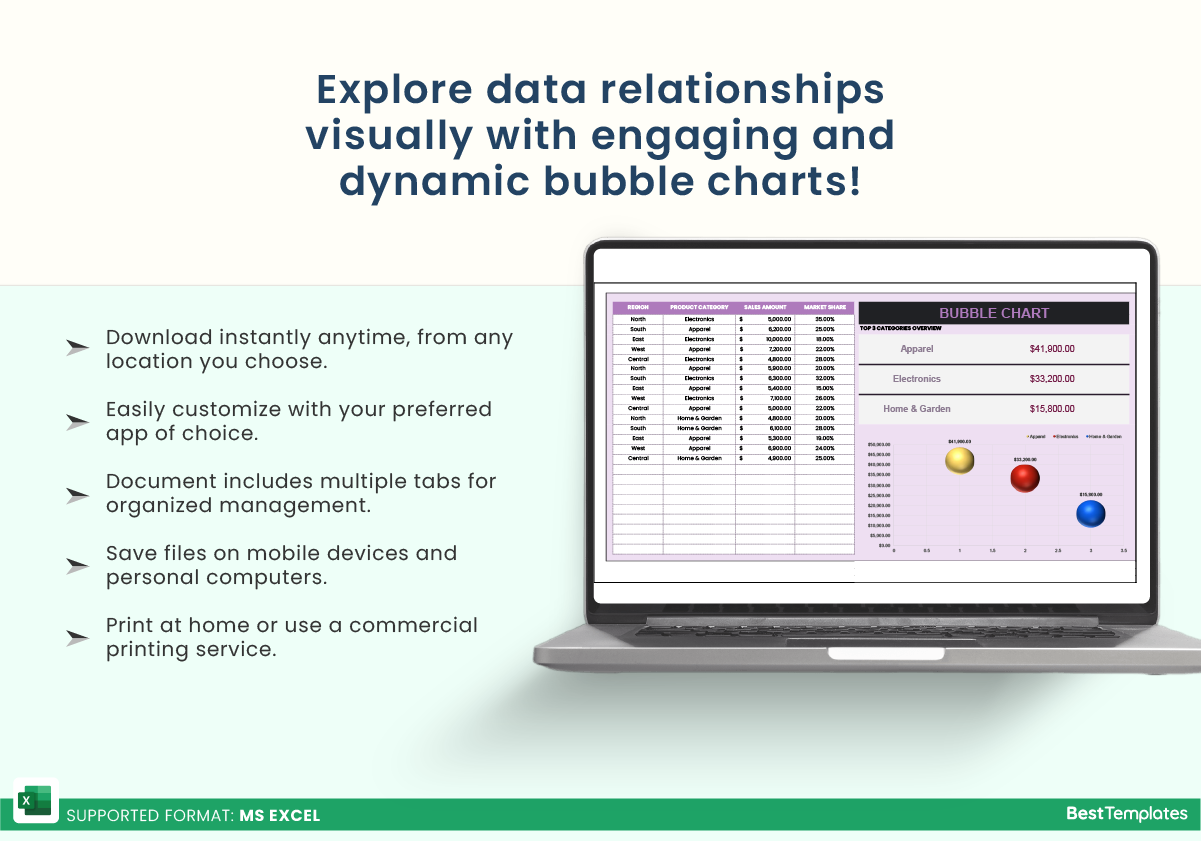
Elevate your data visualization with the Bubble Chart Excel Template from Besttemplates.com. This template is specifically designed to help you analyze complex data sets and present your findings in a visually appealing manner. In the “Bubble Chart” sheet, you can easily enter your necessary data into the provided table, which includes key parameters for your analysis. To the side, you will find a summary section that highlights the top three categories ranked by their highest sales amounts, giving you immediate insights into your most profitable areas. The integrated bubble chart offers a dynamic way to visualize relationships between variables, making it easier to spot trends and patterns in your data. This template is ideal for sales analysis, market research, and any scenario where data interpretation is crucial. With its straightforward layout and powerful visual elements, the Bubble Chart Excel Template is an essential tool for anyone looking to make data-driven decisions.
Key Features:
- User-friendly table for easy data entry
- Summary section highlighting top three sales categories
- Dynamic bubble chart for effective data visualization
- Quick insights into trends and relationships
- Perfect for sales analysis and market research
With the Bubble Chart Excel Template from Besttemplates.com, you can transform your raw data into compelling visuals that tell a story. This template simplifies the analysis process and enhances your ability to communicate insights clearly, making it a must-have for professionals and analysts alike.
Additional Information
| Available Formats | MS Excel |
|---|
Additional Product Info
- Compatibility: Excel 2013, 2016, 2019, 2021, Office 365
- Functionality: No VBA Macros or custom scripts needed
- Orientation Options: Portrait/Landscape
- Color Mode: RGB Color Space
- License Type: Standard License
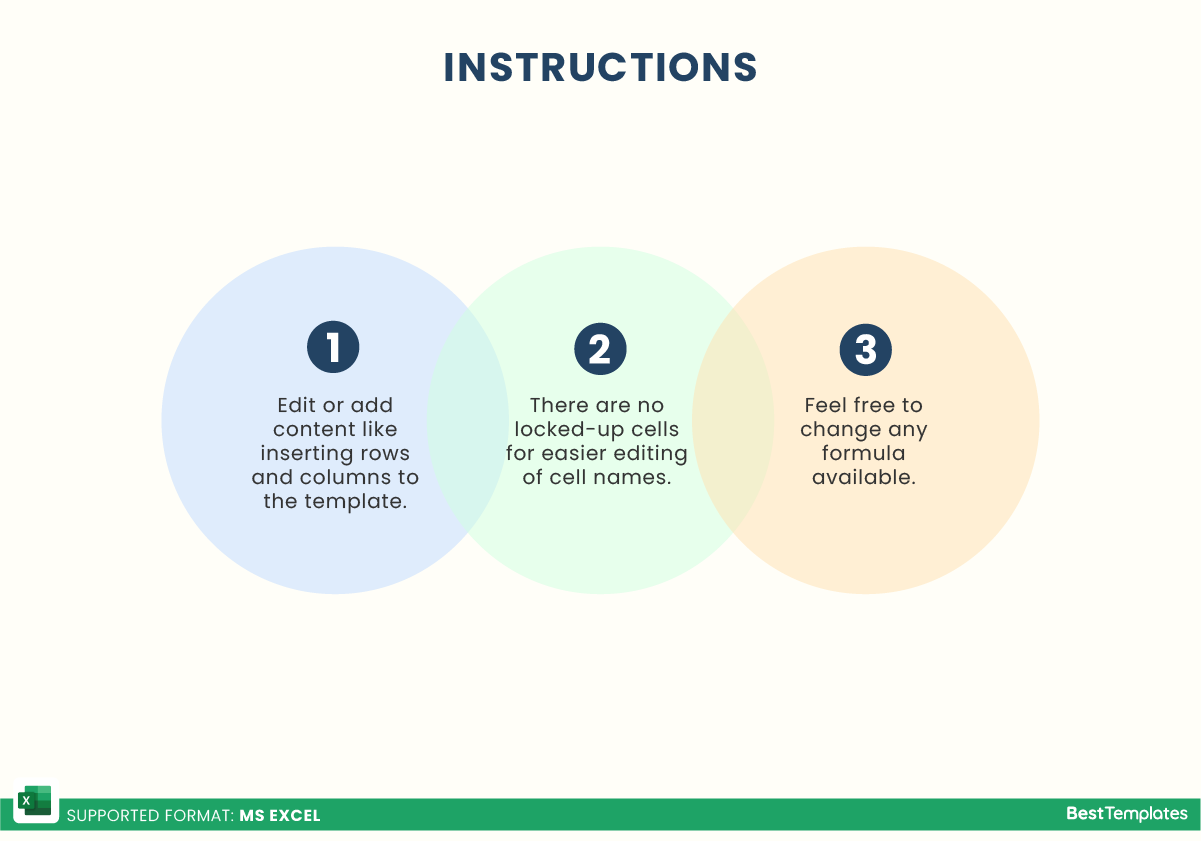
- Customization: Easily editable and customizable
- Font Style: Business standard fonts are used
- Digital Optimization: Optimized for digital use only
- Printing Suitability: Suitable for printing


 No products in the cart.