Break Even Analysis Excel Template
$9.00
Available in stock
Already have an account? Login
Add to cart| Available Formats | MS Excel |
|---|
Description
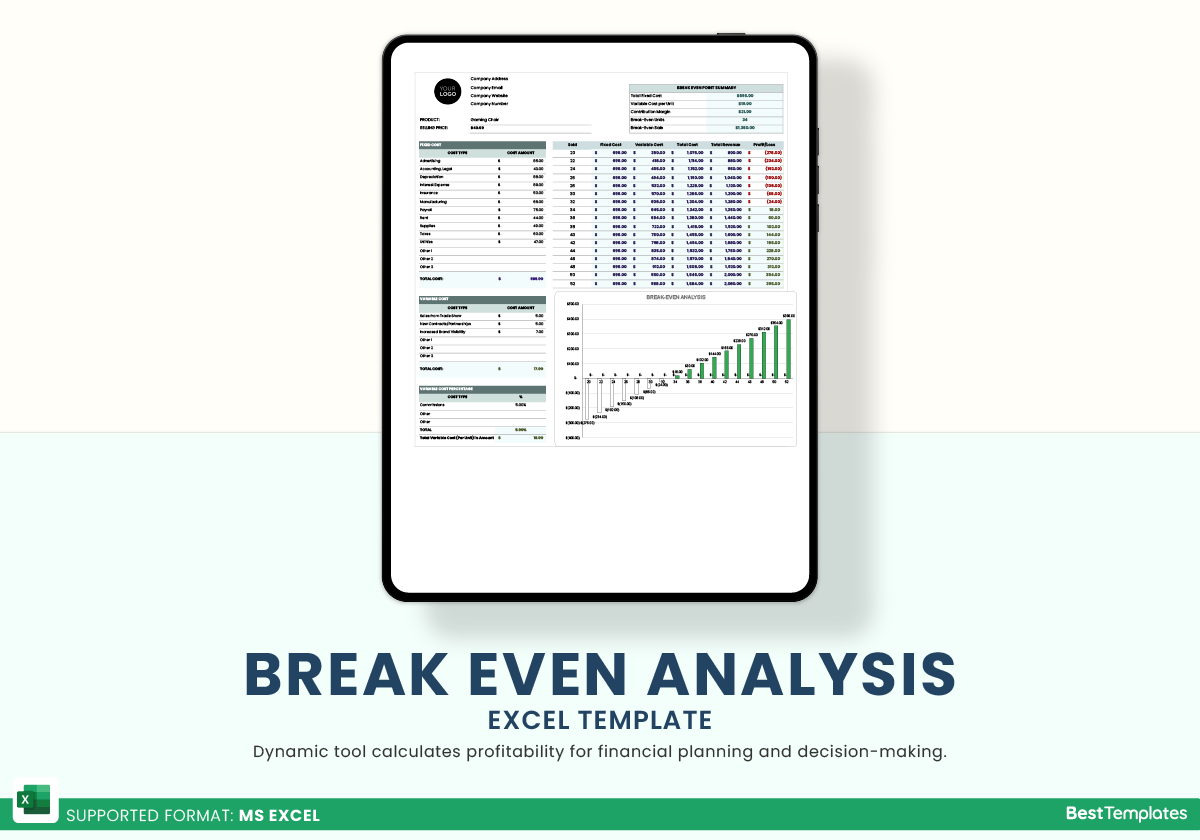
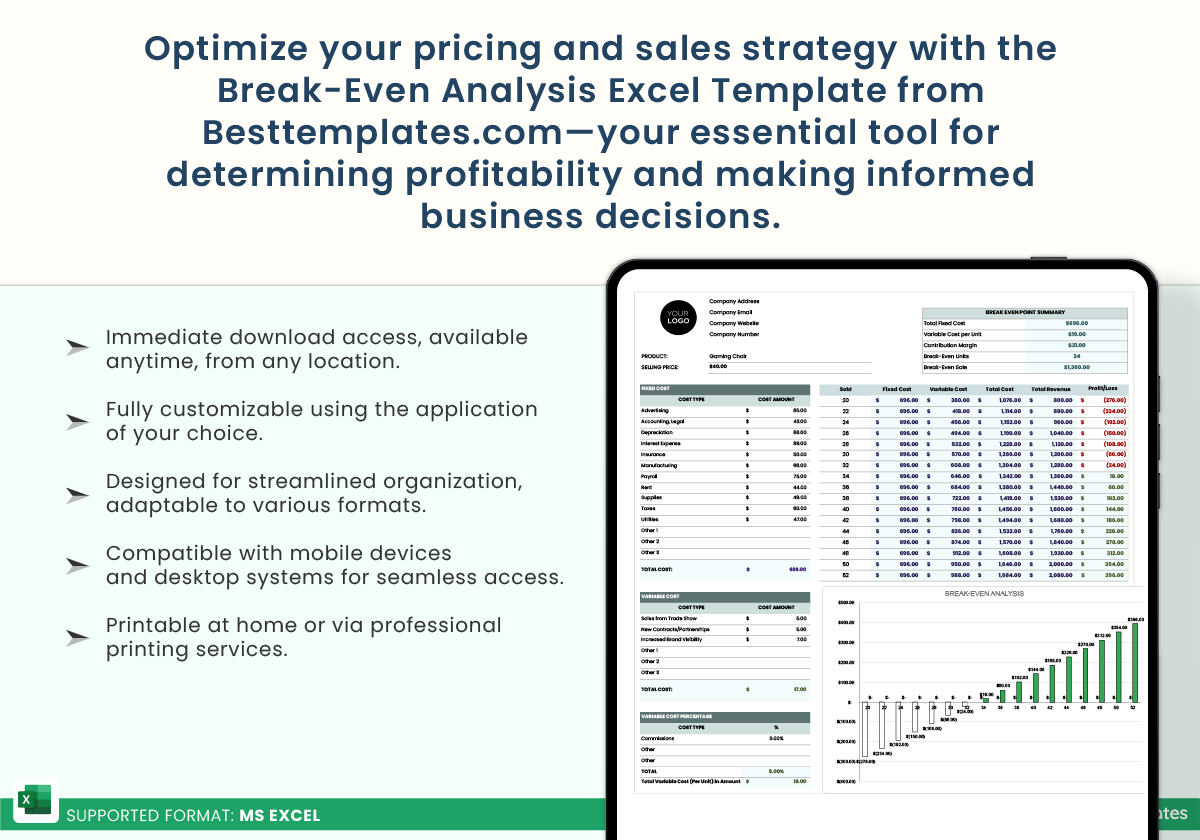
The Break-Even Analysis Excel Template from Besttemplates.com is a powerful and essential tool for businesses looking to determine the point at which their product becomes profitable. This dynamic template allows you to input both fixed and variable costs, providing detailed insights into sales volume, revenue, and profitability.
With easy-to-use features, you can analyze how many units you need to sell to cover your costs, along with visual graphs for a clear, at-a-glance view of your break-even point. This template is perfect for financial planning, product launches, and decision-making for businesses of any size.
Key Features:
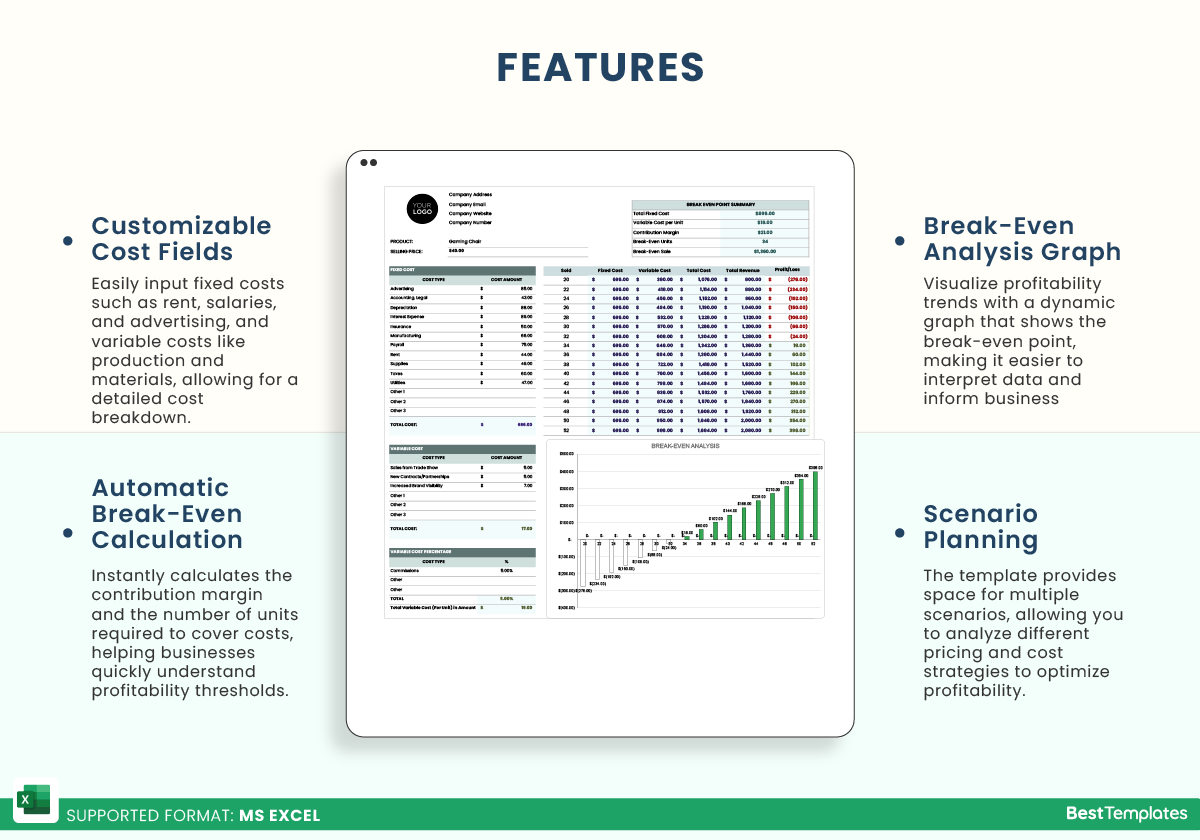
- Customizable fields for fixed costs (e.g., rent, salaries, advertising) and variable costs (e.g., production, materials).
- Automatic calculation of the contribution margin and break-even units.
- Break-even analysis graph showing profitability trends.
- Intuitive, user-friendly layout with space for multiple scenarios.
- Ideal for startups, small businesses, and financial teams to make informed decisions about pricing and sales strategy.
Ensure your business strategies are backed by solid data with this practical, visually appealing template. Available now at Besttemplates.com, it is designed to help businesses succeed by optimizing profitability.
Additional Information
| Available Formats | MS Excel |
|---|
Additional Product Info
- Compatibility: Excel 2021, and Office 365
- Functionality: Auto Formulated
- Orientation Options: Portrait
- Color Mode: RGB Color Space
- License Type: Standard License
- Customization: Easily editable and customizable
- Font Style: Business standard fonts are used
- Digital Optimization: Optimized for digital use only


 No products in the cart.