Bar Chart Excel Template
$9.00
Available in stock
Already have an account? Login
Add to cart| Available Formats | MS Excel |
|---|
Description
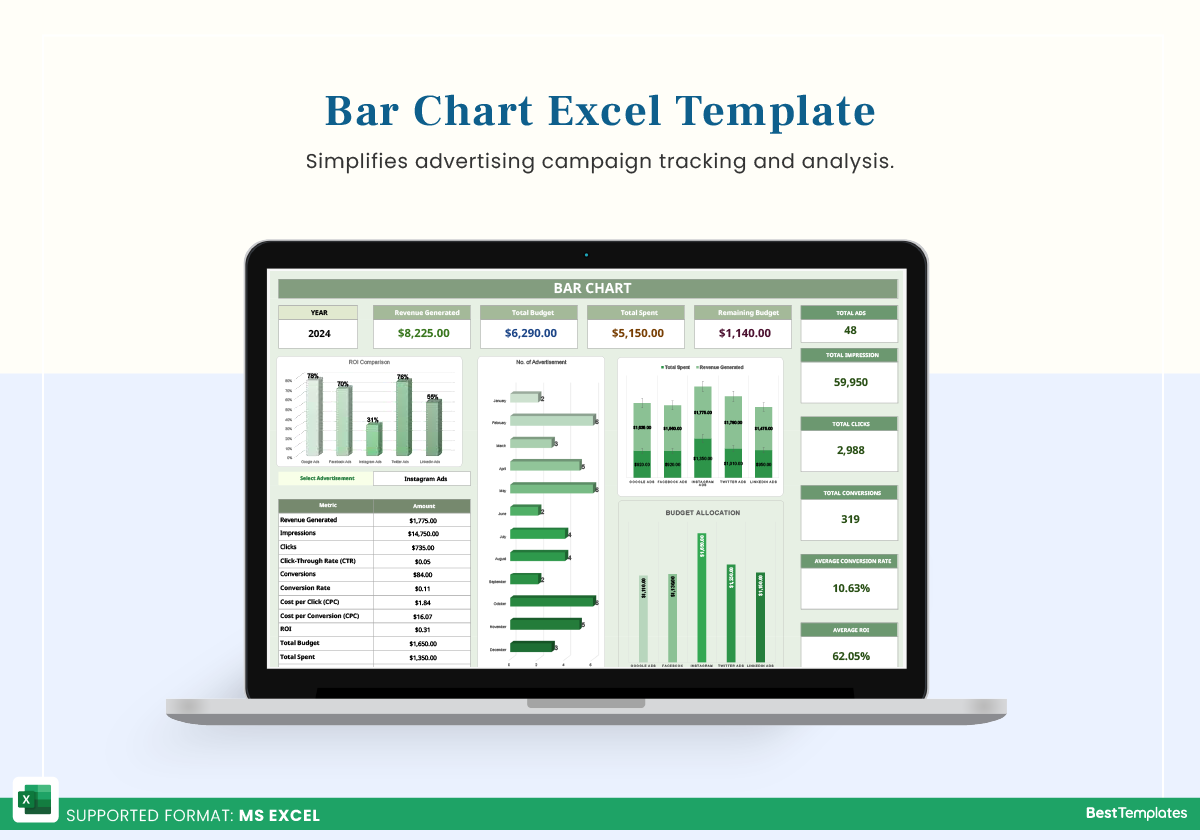
The Bar Chart Excel Template from Besttemplates.com is a versatile tool for tracking and analyzing your advertising campaigns. This template makes it easy to organize and monitor performance metrics, ensuring that every ad you run can be evaluated for its effectiveness and return on investment. With its user-friendly layout and data visualization tools, you can log important data, select specific ads from dropdown menus, and view up-to-date performance summaries, helping you make informed marketing decisions.
Key Features:
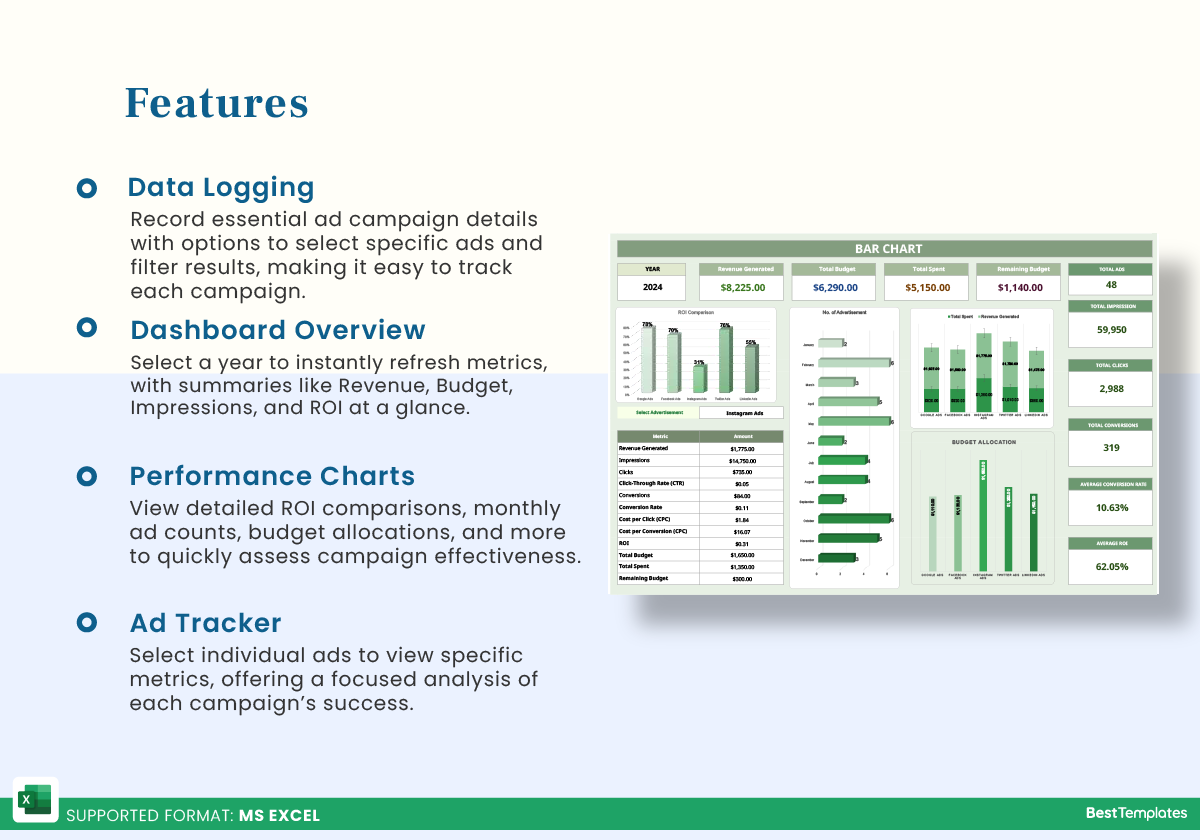
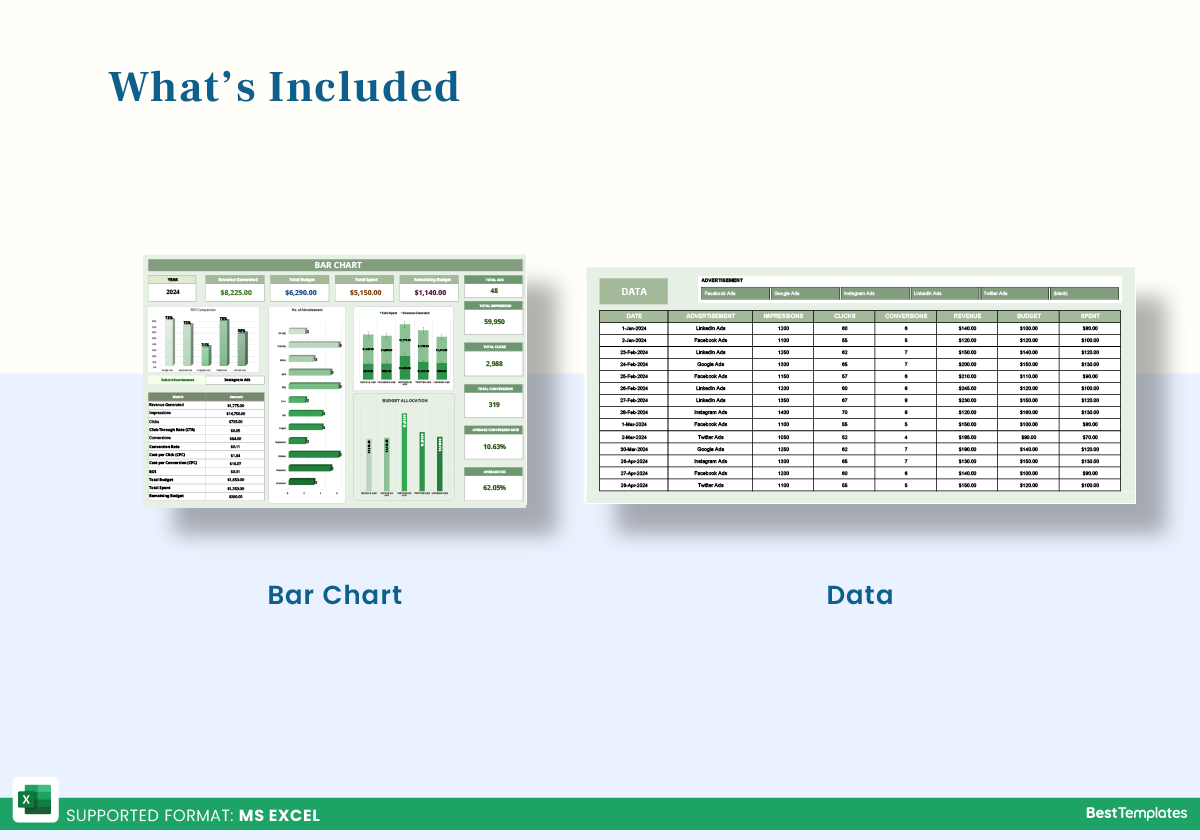
- Data Logging: Input key details for each advertisement campaign, with options to select ads from a dropdown. You can filter results by advertisement to easily access specific data.
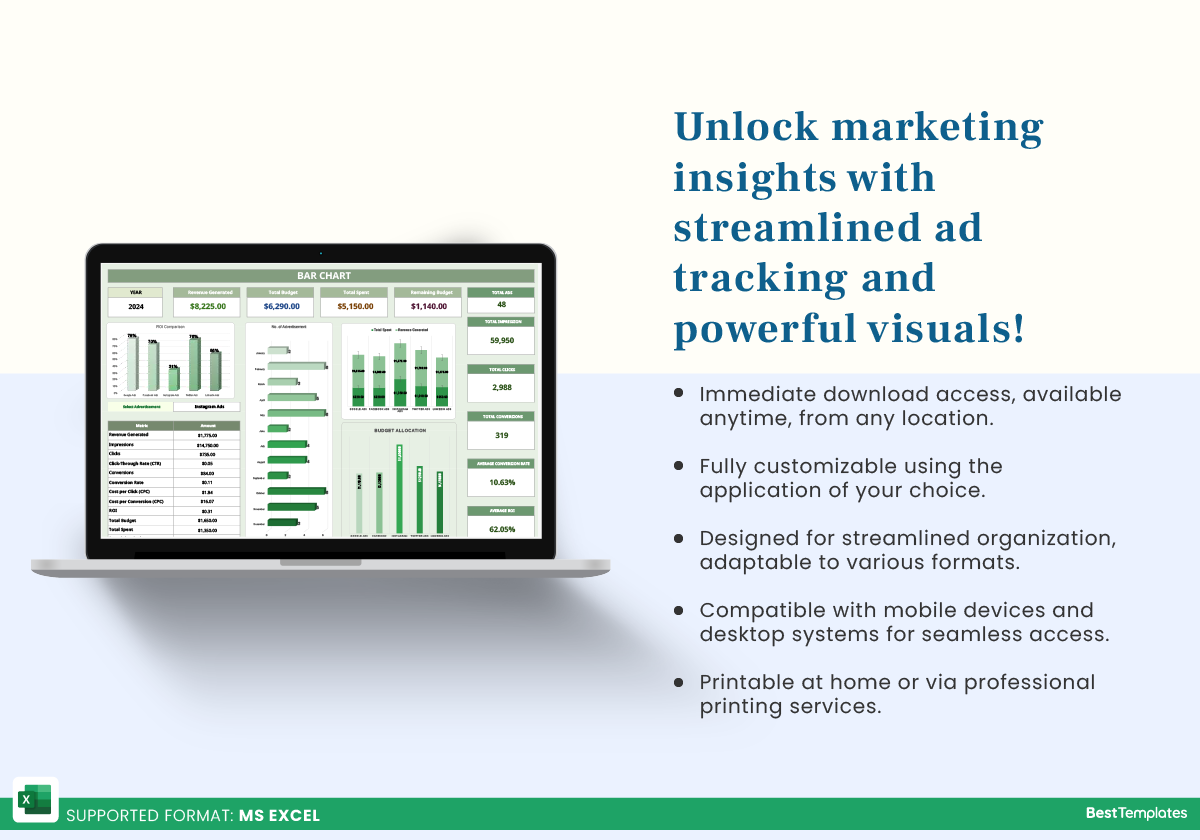
- Dashboard Sheet: Select a year from the dropdown to instantly update metrics. This sheet includes overviews of Revenue Generated, Total Budget, Total Spent, and Remaining Budget, along with additional insights like Total Ads, Total Impressions, Total Clicks, Total Conversions, Average Conversion Rate, and Average ROI.
- Performance Charts: Visuals for ROI comparison, monthly ad counts, total spent vs. revenue, and budget allocation offer a quick, clear snapshot of campaign performance.
- Ad Performance Tracker: Choose an ad from the dropdown to view specific metrics, making it simple to drill down into individual ad performance.
The Bar Chart Excel Template on Besttemplates.com is a must-have for marketers looking to analyze their ad campaigns in-depth, offering a streamlined way to track ROI and make data-driven adjustments.
Additional Information
| Available Formats | MS Excel |
|---|
Additional Product Info
- Compatibility: Excel 2021, Office 365
- Functionality: No VBA Macros or custom scripts needed
- Orientation Options: Portrait/Landscape
- Color Mode: RGB Color Space
- License Type: Standard License
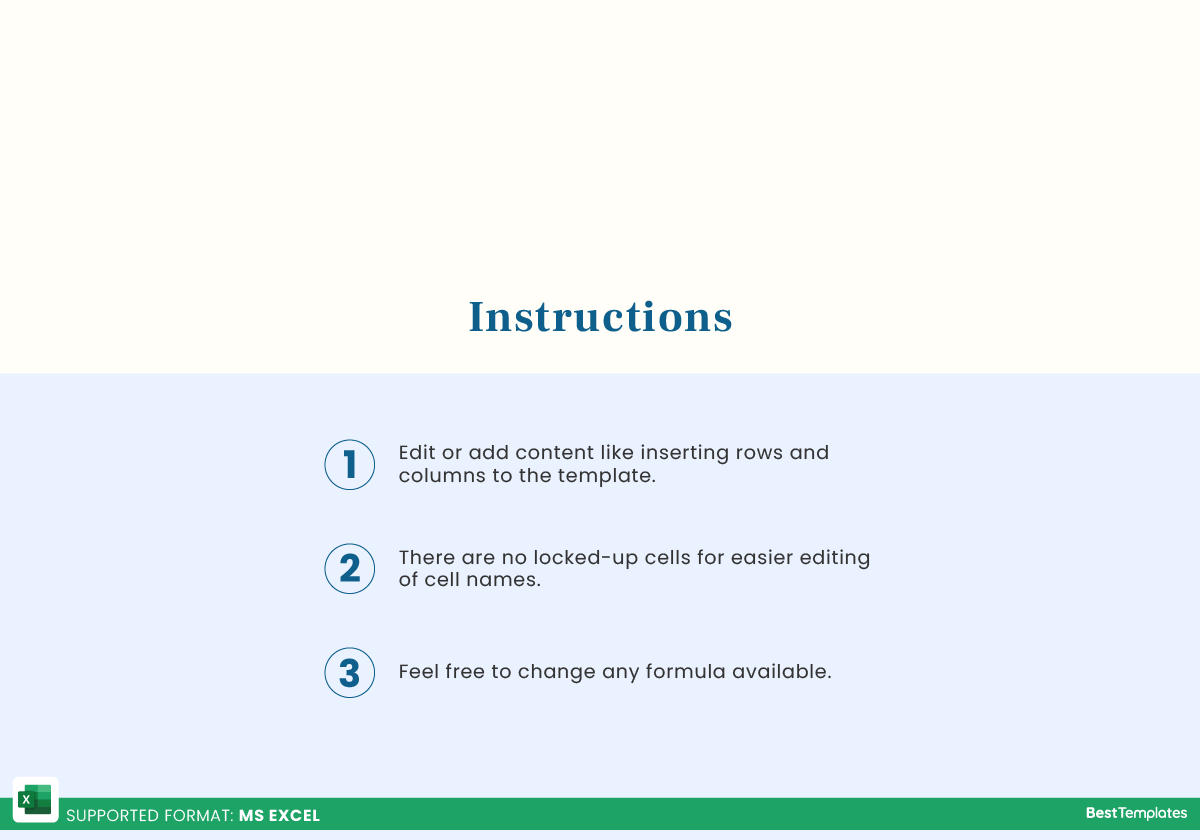
- Customization: Easily editable and customizable
- Font Style: Business standard fonts are used
- Digital Optimization: Optimized for digital use only
- Printing Suitability: Suitable for printing


 No products in the cart.