Area Chart Excel Template
$9.00
Available in stock
Already have an account? Login
Add to cart| Available Formats | MS Excel |
|---|
Description
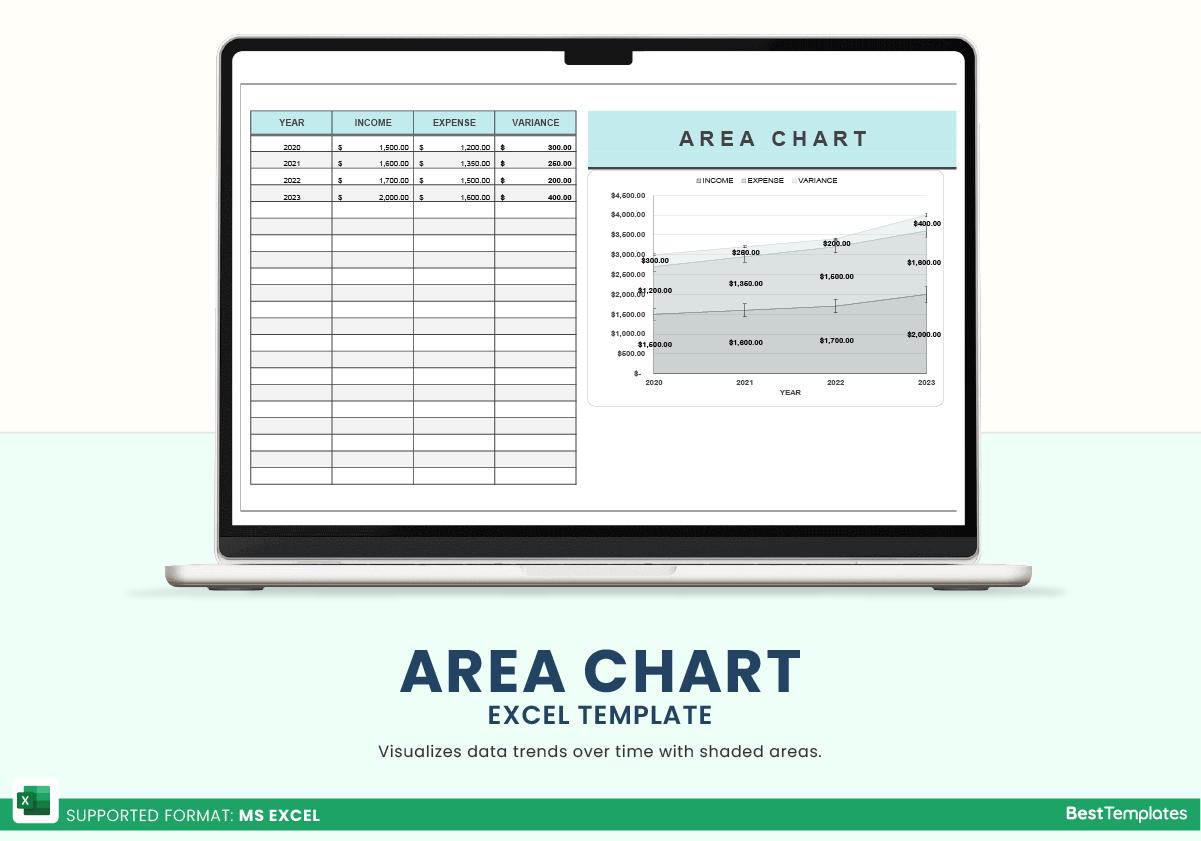
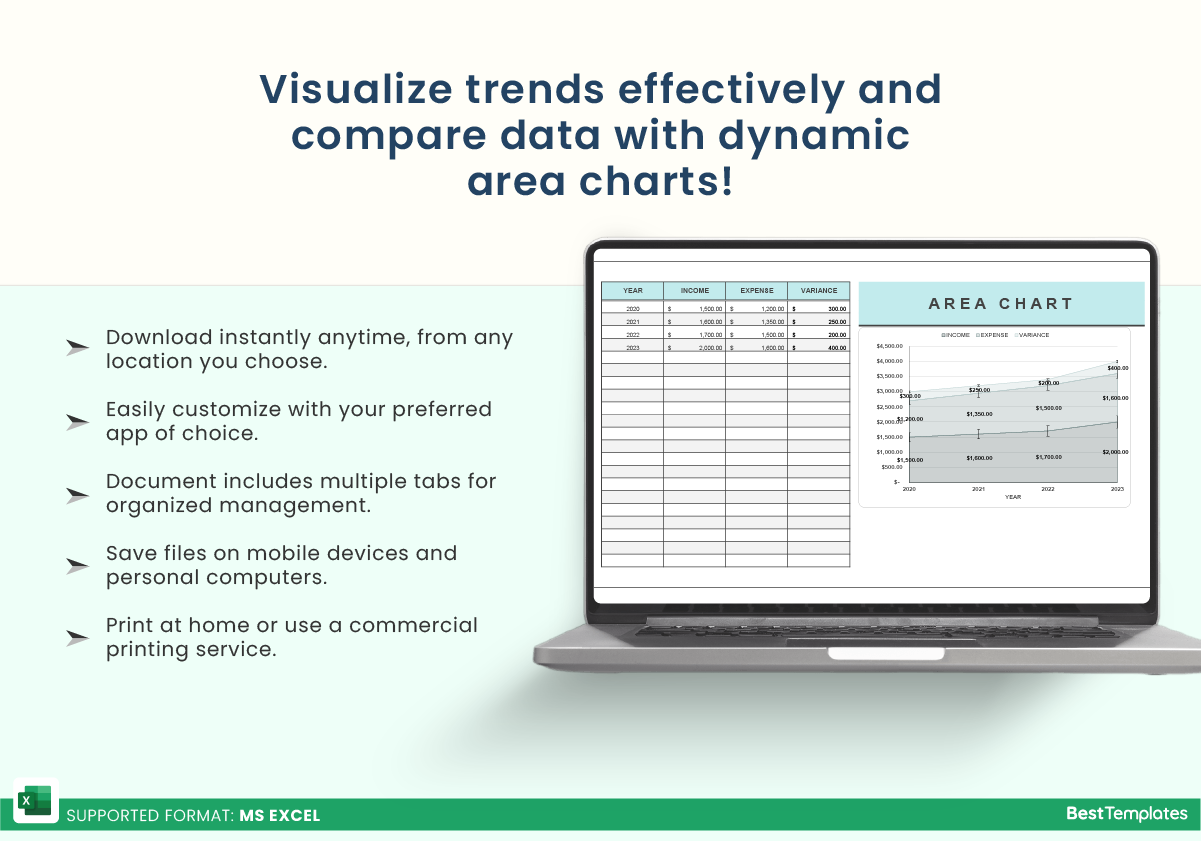
Maximize your financial analysis with the Area Chart Excel Template from Besttemplates.com. This intuitive template is designed to help you visualize your yearly income and expenses effectively. Upon opening the template, you’ll find a well-organized table where you can input your income and expense amounts for each category. One of the standout features is the automatically calculated variance column, which provides instant insights into your financial performance. This feature allows you to quickly assess how your income measures against your expenses, helping you make informed decisions. Accompanying the data table is a visually engaging area chart that facilitates easy visualization and analysis of your financial trends over the year. Whether you’re managing personal finances or overseeing a business budget, this template offers the clarity and precision you need to stay on top of your financial health.
Key Features:
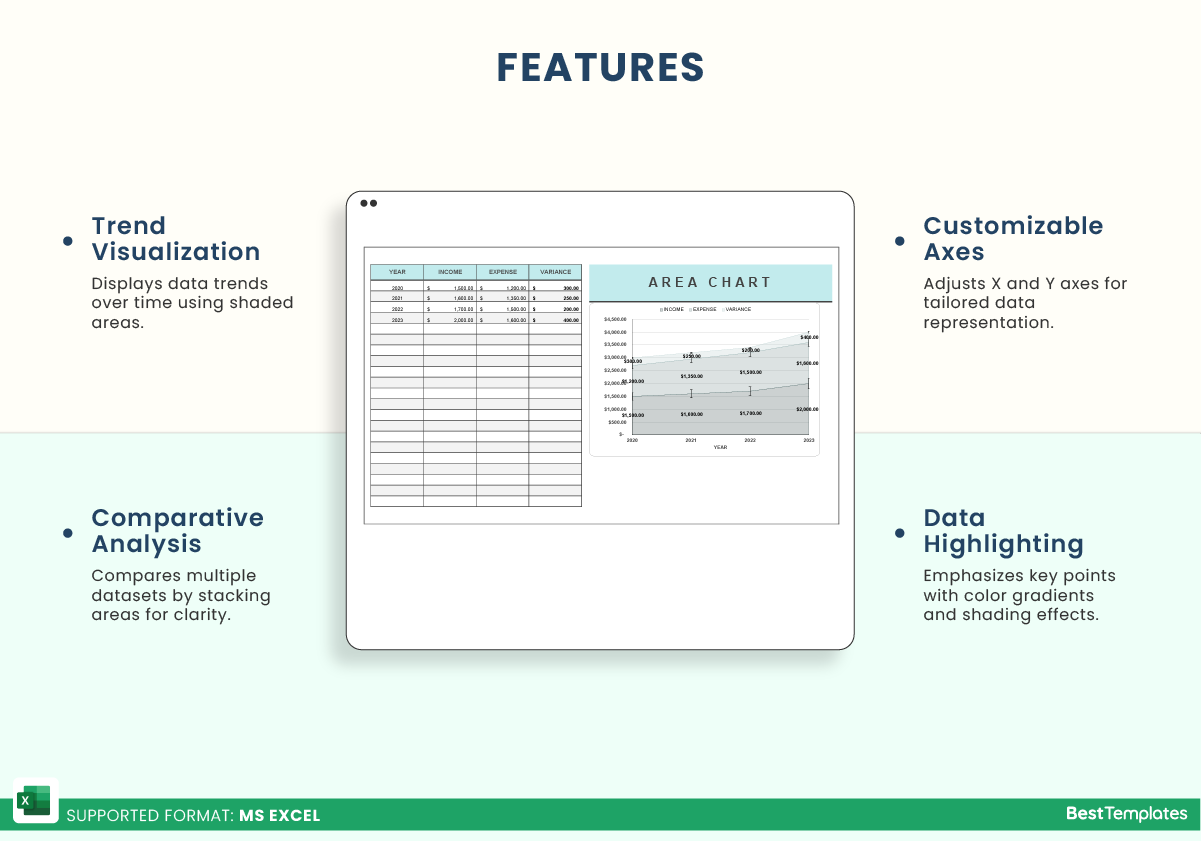
- User-friendly table for inputting yearly income and expenses
- Automatically calculated variance column for instant insights
- Engaging area chart for visual representation of financial data
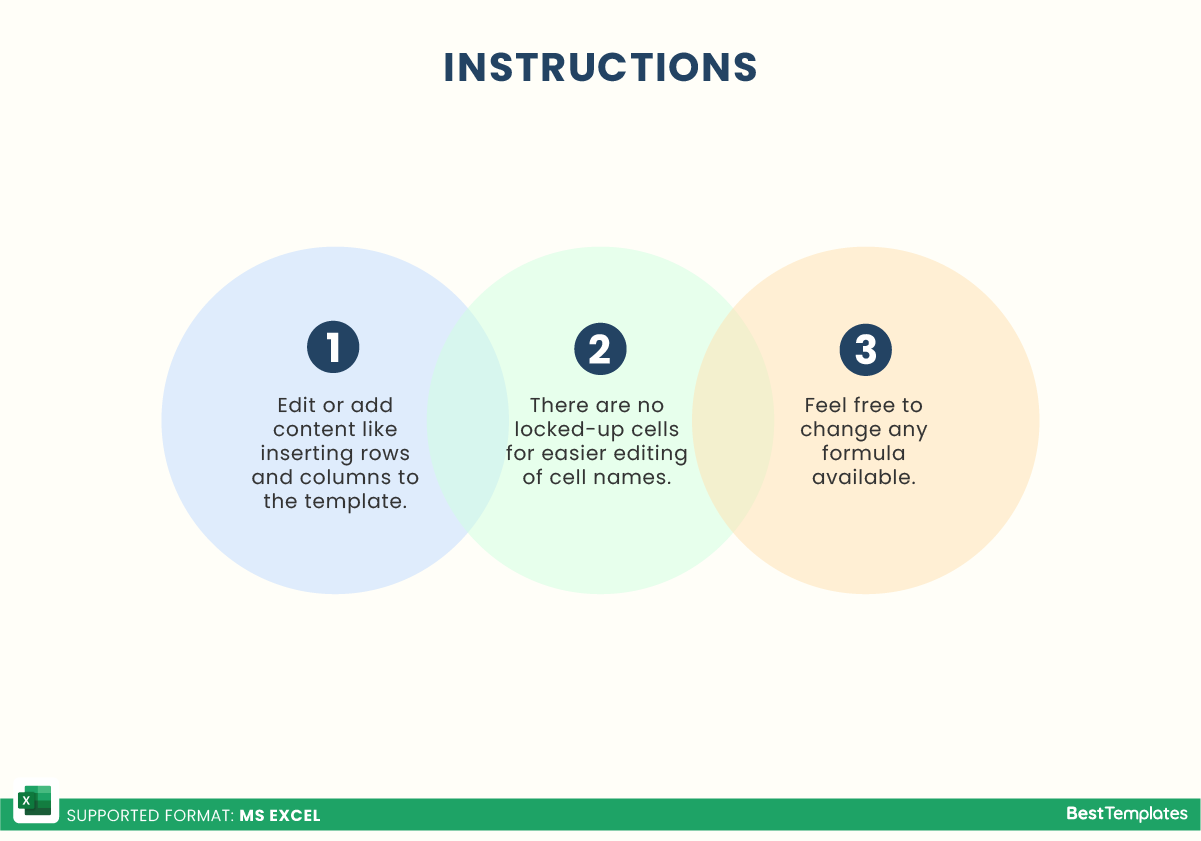
- Easy-to-use format for quick data entry and analysis
- Ideal for personal finance management or business budgeting
With the Area Chart Excel Template from Besttemplates.com, you can enhance your financial tracking and analysis like never before. This template not only simplifies your budgeting process but also empowers you to visualize your financial health, making it an essential tool for anyone looking to manage their finances effectively.
Additional Information
| Available Formats | MS Excel |
|---|
Additional Product Info
- Compatibility: Excel 2013, 2016, 2019, 2021, Office 365
- Functionality: No VBA Macros or custom scripts needed
- Orientation Options: Portrait/Landscape
- Color Mode: RGB Color Space
- License Type: Standard License
- Customization: Easily editable and customizable
- Font Style: Business standard fonts are used
- Digital Optimization: Optimized for digital use only
- Printing Suitability: Suitable for printing


 No products in the cart.