Sunburst Chart Excel Template
$9.00
Available in stock
Already have an account? Login
Add to cart| Available Formats | MS Excel |
|---|
Description
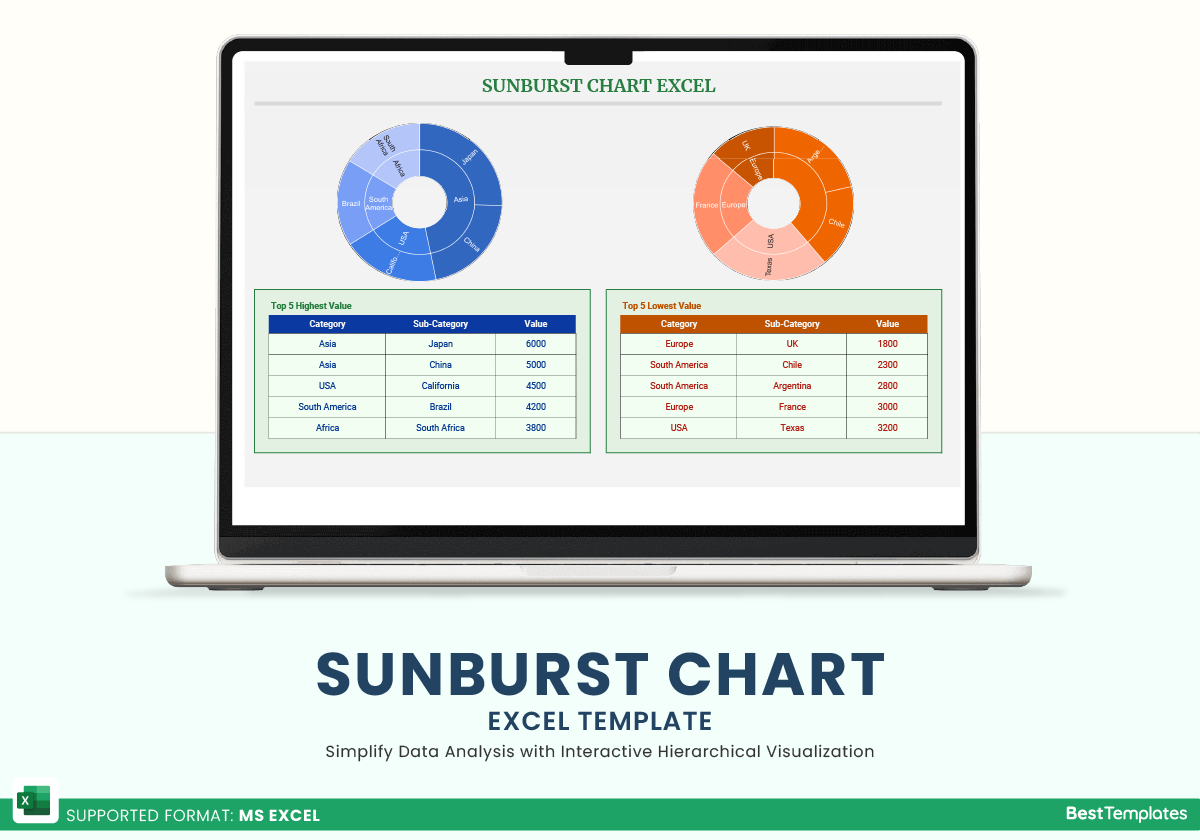
The Sunburst Chart Excel Template available on Besttemplates.com is a powerful and intuitive tool designed to help you visualize hierarchical data with ease. This template allows users to input data effortlessly in the “Data Input” sheet, where they can fill in categories, values, and relevant information. The category column is equipped with a dropdown menu to ensure accurate and consistent data entry. Once the data is entered, the “Sunburst Chart” sheet automatically displays the Top 5 highest values in a visually engaging sunburst chart, along with the Top 5 lowest values in a separate sunburst chart. This template makes it simple to track key metrics, understand data hierarchies, and identify trends quickly and effectively. Whether you’re analyzing sales data, product categories, or any hierarchical structure, the Sunburst Chart Excel Template offers clear insights through its dynamic, visually interactive charts.
Key Features:
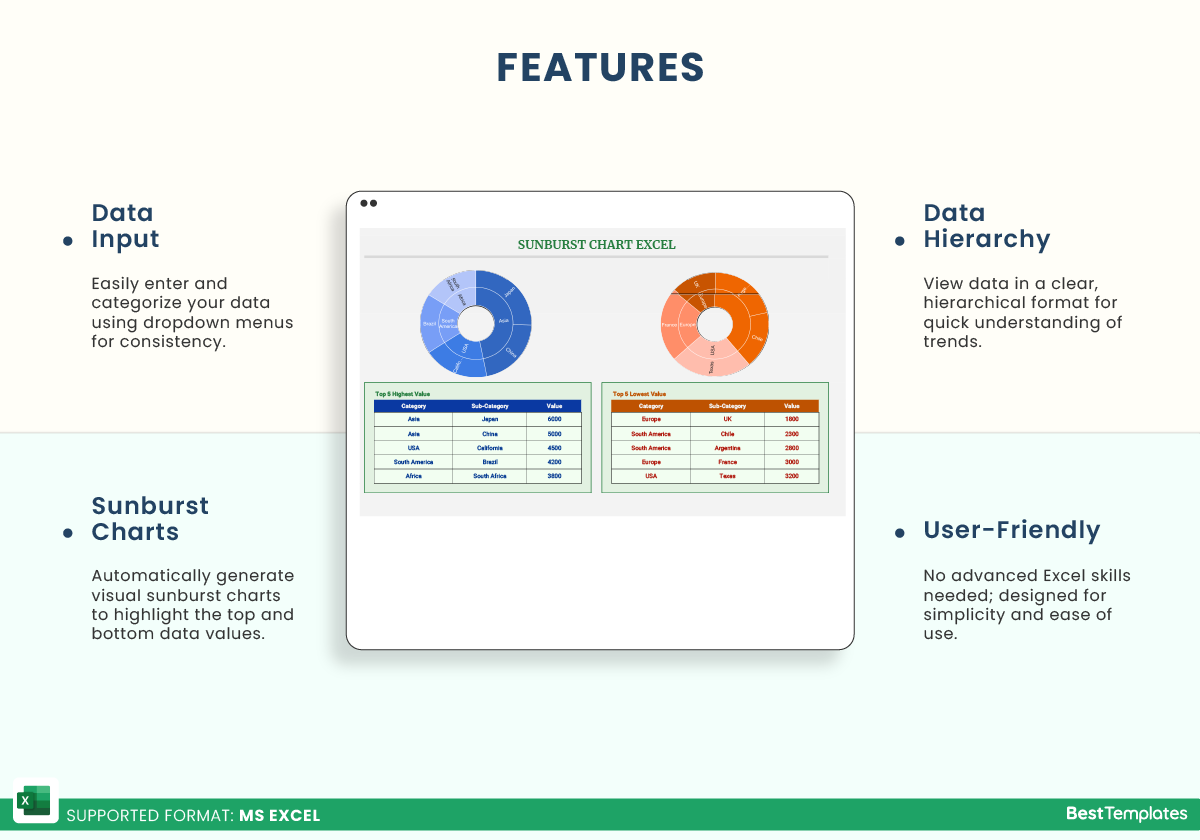
- Easy Data Entry: Input data easily in the “Data Input” sheet with a dropdown menu for categories.
- Sunburst Visualization: Automatically generate sunburst charts for both Top 5 highest and lowest values.
- Data Hierarchy: View hierarchical data in a structured, visual format for quick insights.
- User-Friendly: No advanced Excel skills required to navigate and use the template effectively.
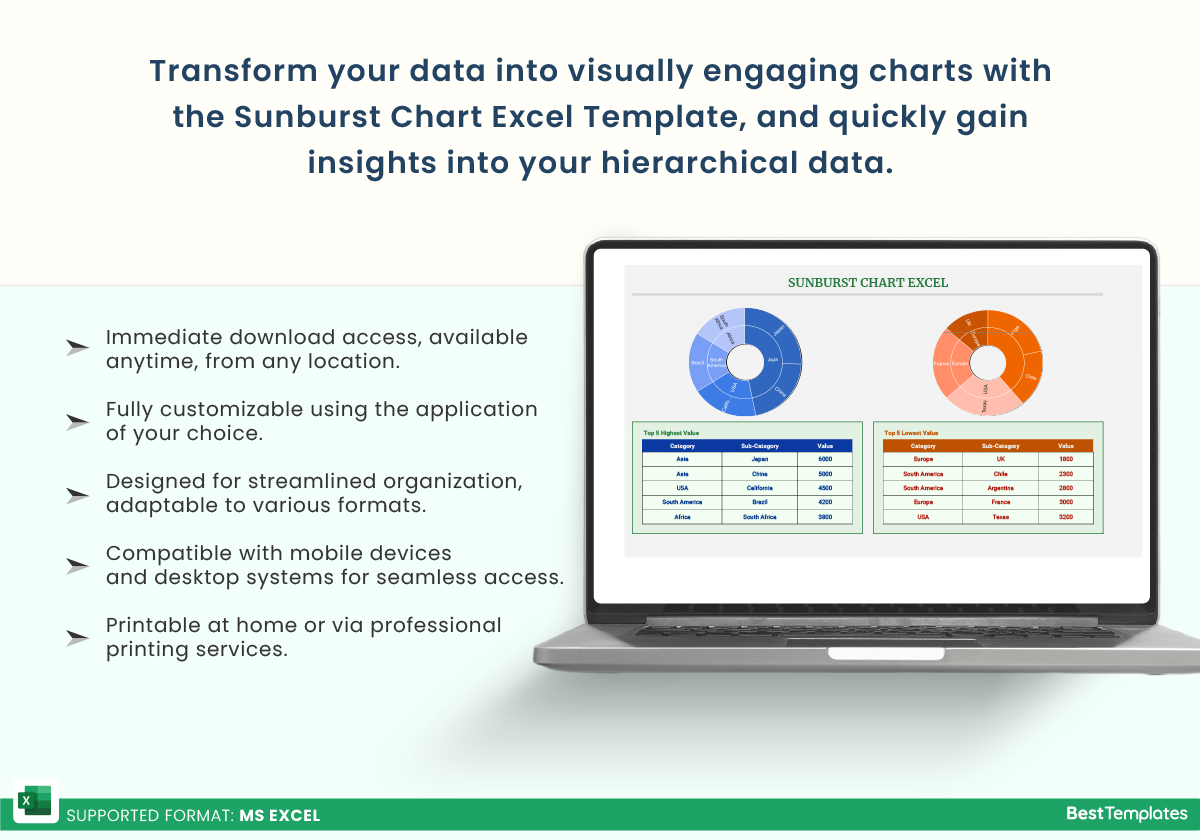
The Sunburst Chart Excel Template is perfect for those who want to streamline data analysis and enhance reporting through clear, visually appealing charts. It helps simplify complex data sets and highlights the most important trends, making it easier to draw actionable insights. Whether for business, personal projects, or data analysis, this template is an essential tool for anyone looking to visualize data hierarchies efficiently and effectively.
Additional Information
| Available Formats | MS Excel |
|---|
Additional Product Info
- Compatibility: Excel 2021, Office 365
- Functionality: No VBA Macros or custom scripts needed
- Orientation Options: Portrait/Landscape
- Color Mode: RGB Color Space
- License Type: Standard License
- Customization: Easily editable and customizable
- Font Style: Business standard fonts are used
- Digital Optimization: Optimized for digital use only
- Printing Suitability: Suitable for printing



 No products in the cart.