Temperature Graph Excel Template
$9.00
Available in stock
Already have an account? Login
Add to cart| Available Formats | MS Excel |
|---|
Description
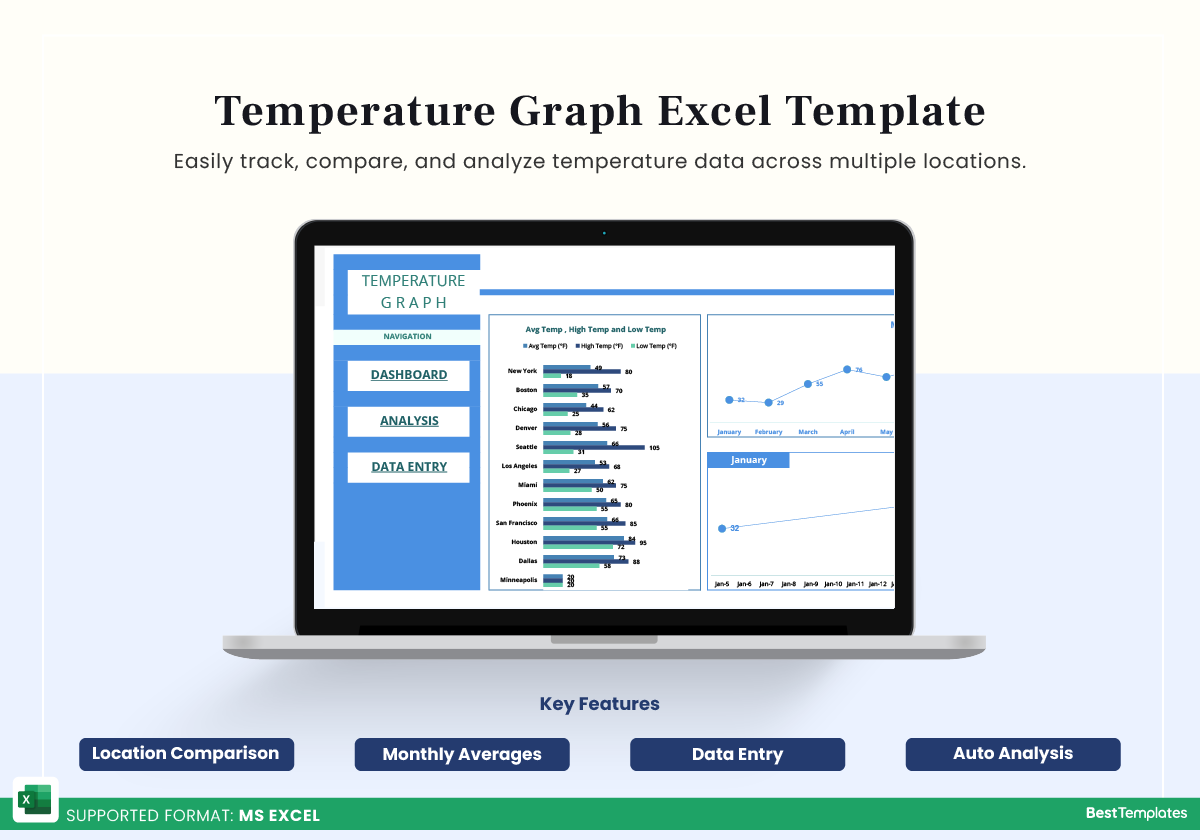
Easily track, compare, and analyze temperature data with the Temperature Graph Excel Template from Besttemplates.com. This powerful tool is perfect for those looking to maintain a detailed record of temperature patterns, whether for personal, scientific, or business use. With automated charts, organized data entry, and clear temperature summaries, this template streamlines data management for comprehensive temperature analysis.
Key Features
- Comparative Charts
- Monthly Averages
- Data Entry
- Automated Analysis
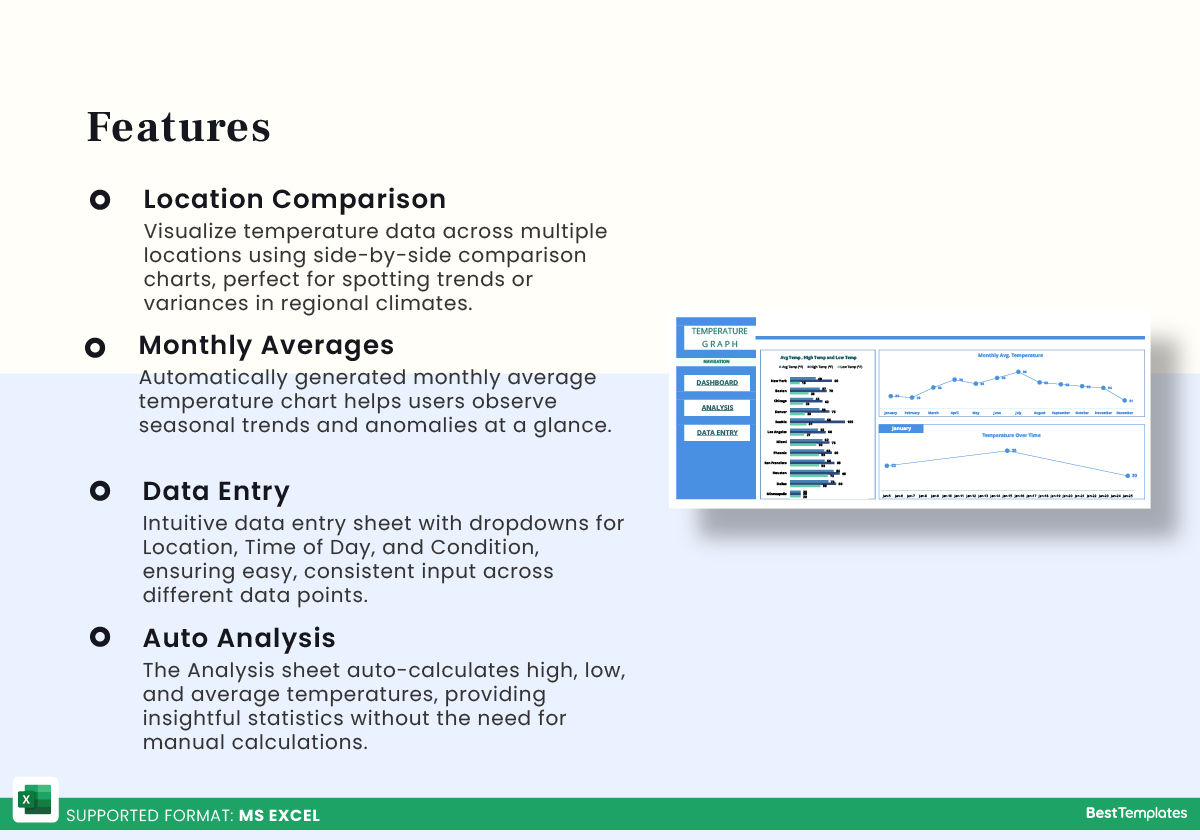
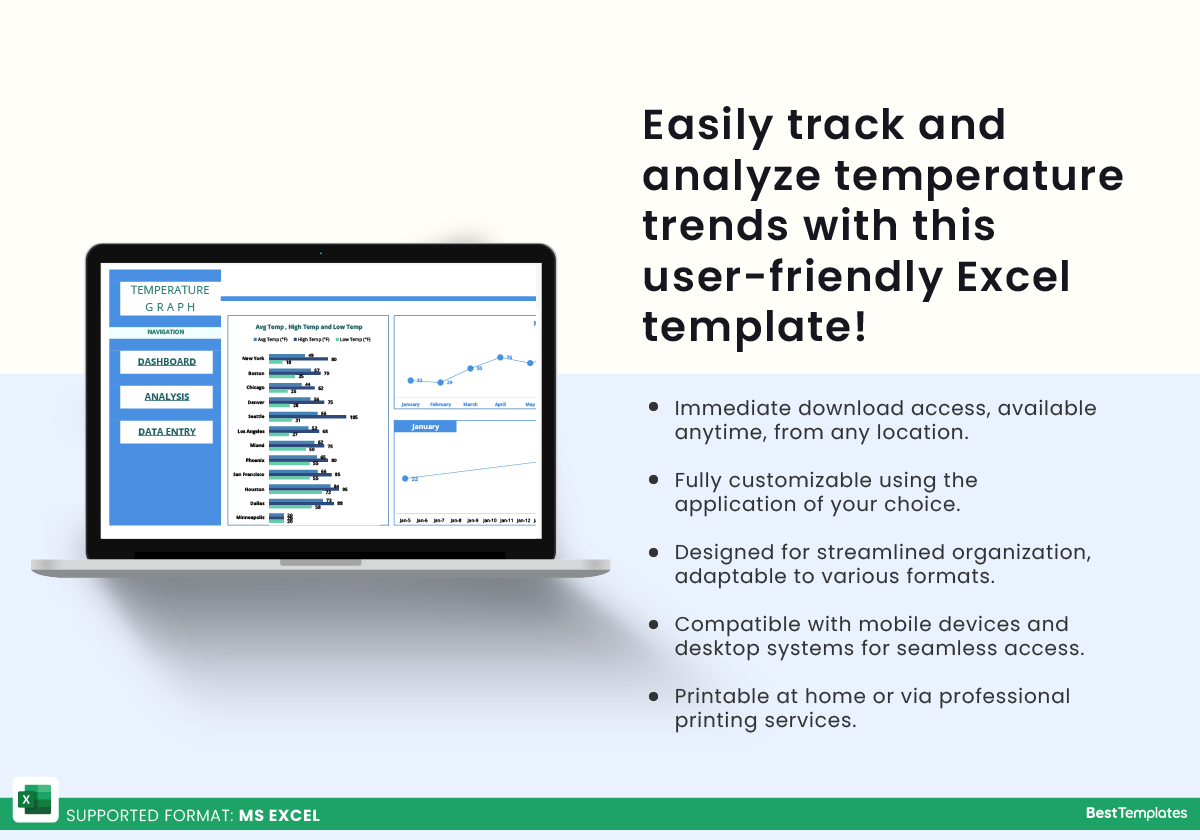
Comparative Charts: The main “Dashboard” sheet features visually engaging charts that compare temperature readings across multiple locations, daily patterns, and monthly averages, providing an easy-to-understand overview of trends.
Monthly Averages: Displays a dedicated chart to show monthly average temperatures, allowing users to quickly see patterns or anomalies over time.
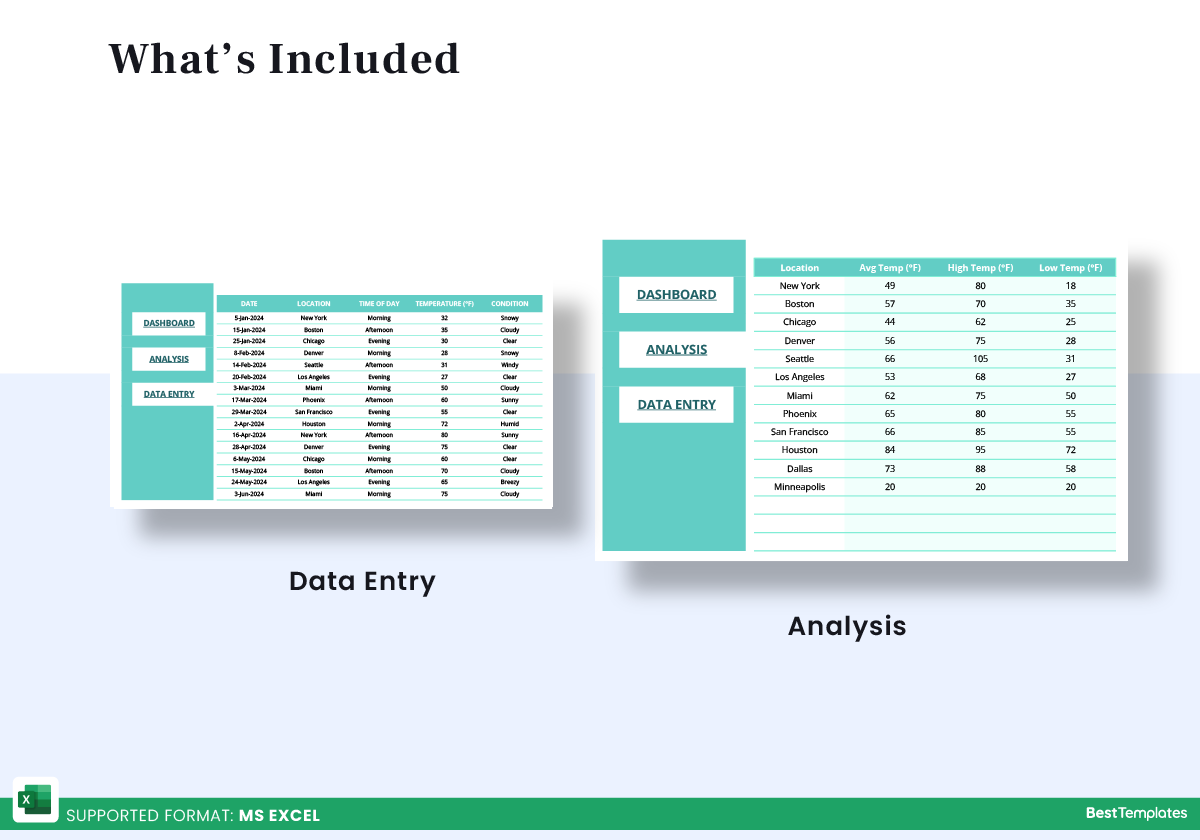
Data Entry: Simplified data entry sheet with dropdown selections for location, time of day, and condition, helping ensure accurate data input across different parameters.
Automated Analysis: The “Analysis” sheet is auto-formulated, presenting high, low, and average temperatures for a clear snapshot of your data, making it easy to interpret trends without manual calculations.
With Besttemplates.com‘s Temperature Graph Excel Template, you can organize and analyze temperature data effortlessly, from input to insights, all in one place.
Additional Information
| Available Formats | MS Excel |
|---|
Additional Product Info
- Compatibility: Excel 2021, Office 365
- Functionality: No VBA Macros or custom scripts needed
- Orientation Options: Portrait/Landscape
- Color Mode: RGB Color Space
- License Type: Standard License
- Customization: Easily editable and customizable
- Font Style: Business standard fonts are used
- Digital Optimization: Optimized for digital use only
- Printing Suitability: Suitable for printing


 No products in the cart.