Chart Diagram Excel Template
$9.00
Available in stock
Already have an account? Login
Add to cart| Available Formats | MS Excel |
|---|---|
| Sub Category | Charts |
Description
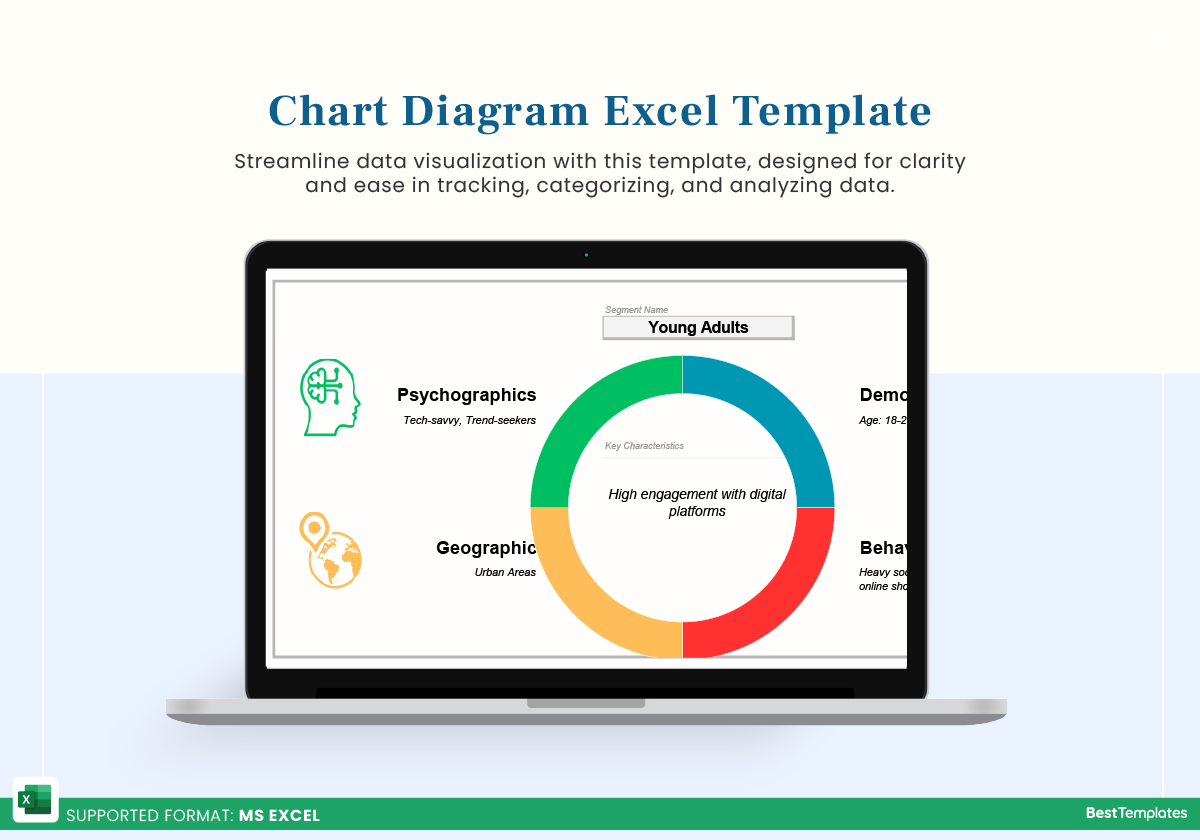
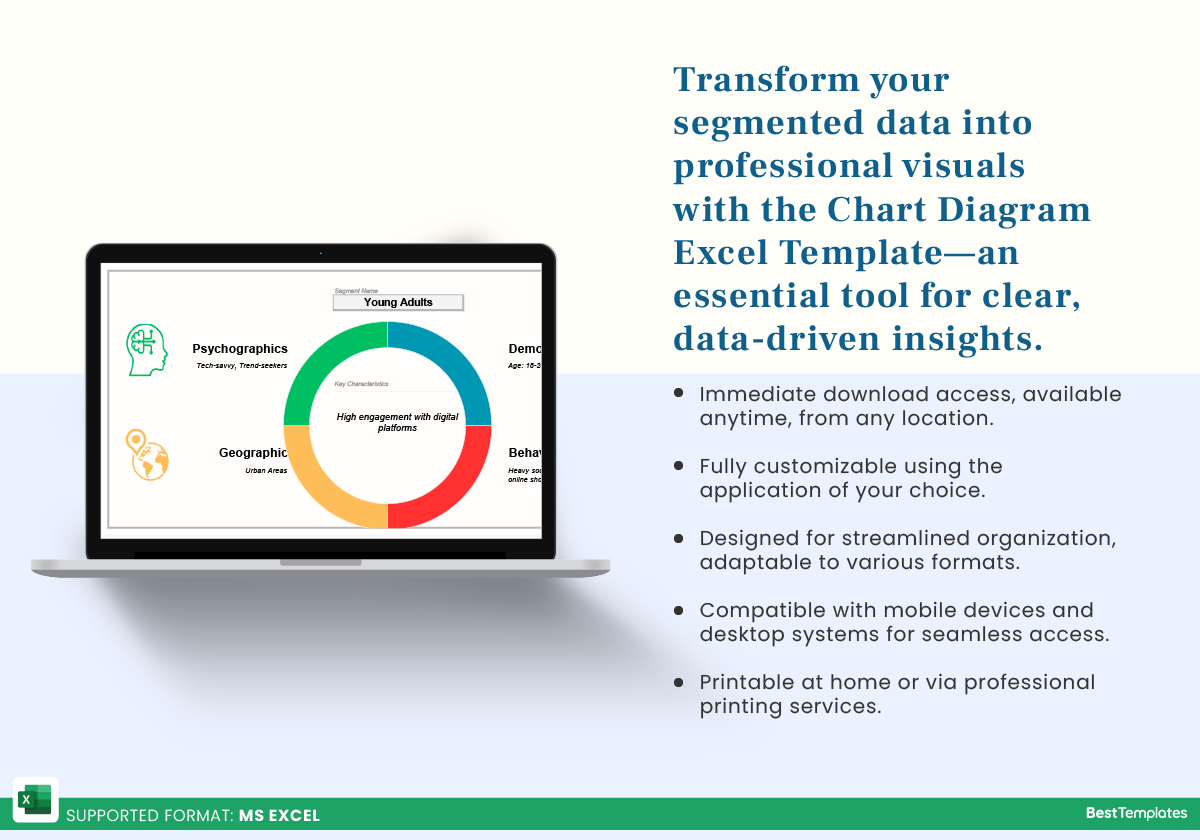
Streamline your data visualization process with the Chart Diagram Excel Template from Besttemplates.com. Designed for clarity and efficiency, this template allows users to organize and analyze segmented data with ease. Ideal for professionals, it provides an intuitive structure for categorizing information, tracking progress, and generating dynamic, visually engaging charts. Whether you’re managing project data, tracking sales performance, or monitoring other segmented data, this template offers a user-friendly solution for clear and compelling presentations.
Key Features:
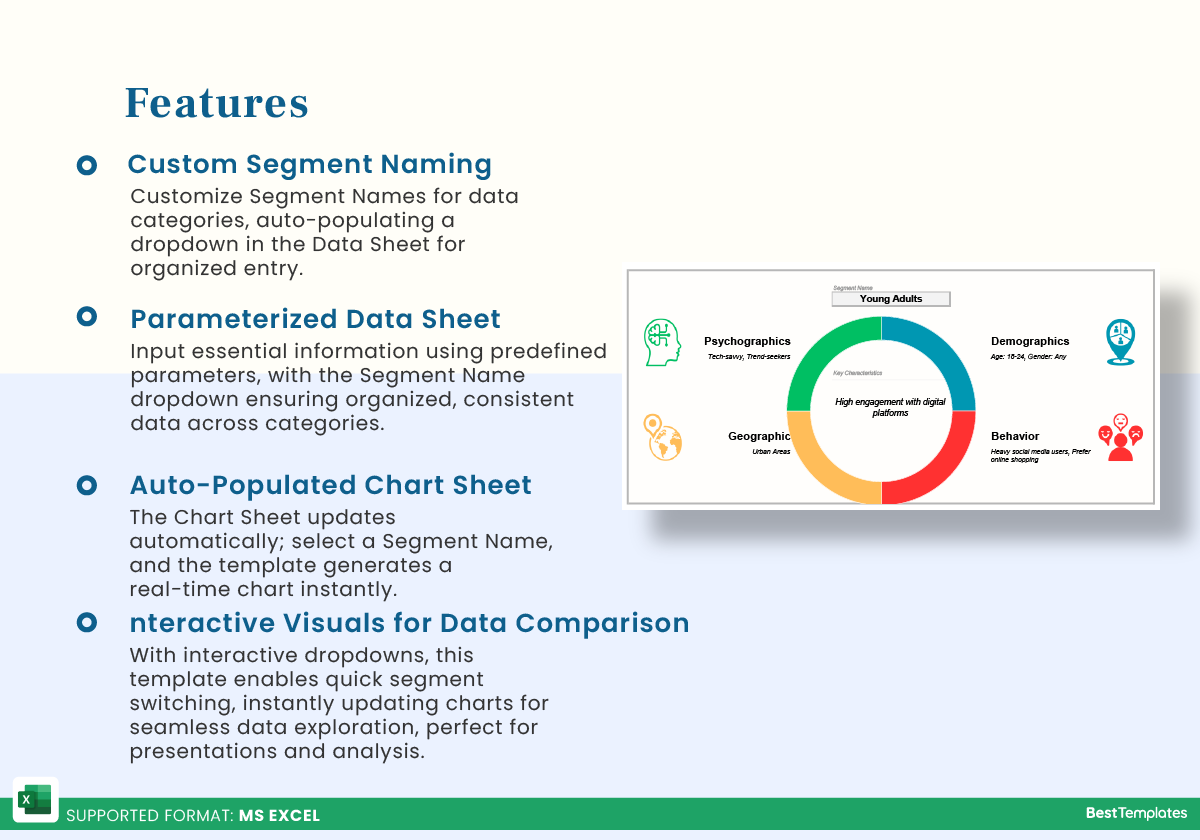
- Custom Segment Naming: Start by manually entering your unique Segment Names, which will be used to categorize data in the template. These names populate a dropdown list in the Data Sheet, allowing for seamless organization and selection of each data segment.
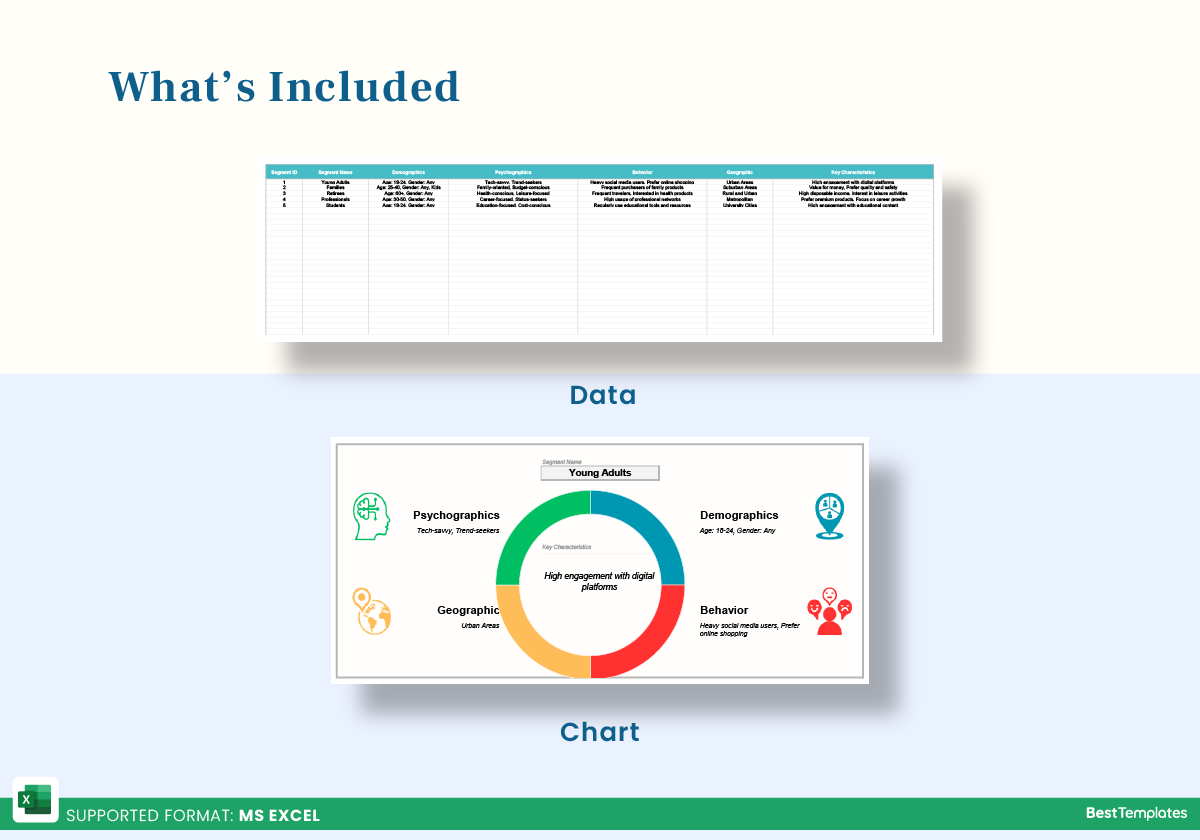
- Data Sheet with Parameters: The Data Sheet includes predefined parameters for entering your key information. Use the Segment Name dropdown to assign each entry to its appropriate category, ensuring consistent and organized data input across segments.
- Auto-Populated Chart Sheet: The Chart Sheet is fully automated and requires no manual adjustments. Simply select a Segment Name from the dropdown menu, and the relevant data will instantly populate the chart, providing a real-time, visual representation based on the selected segment.
- Interactive Visuals for Analysis: With its interactive dropdown functionality, this template allows you to switch between segments and instantly view data-specific charts. This feature is perfect for presentations, detailed analysis, or quick data comparison.
Effortlessly manage and visualize your segmented data with the Chart Diagram Excel Template, turning complex information into clear, professional visuals that support data-driven decision-making.
Additional Information
| Available Formats | MS Excel |
|---|---|
| Sub Category | Charts |
Additional Product Info
- Compatibility: Excel 2013, 2016, 2019, 2021, Office 365
- Functionality: No VBA Macros or custom scripts needed
- Orientation Options: Portrait/Landscape
- Color Mode: RGB Color Space
- License Type: Standard License
- Customization: Easily editable and customizable
- Font Style: Business standard fonts are used
- Digital Optimization: Optimized for digital use only
- Printing Suitability: Suitable for printing


 No products in the cart.