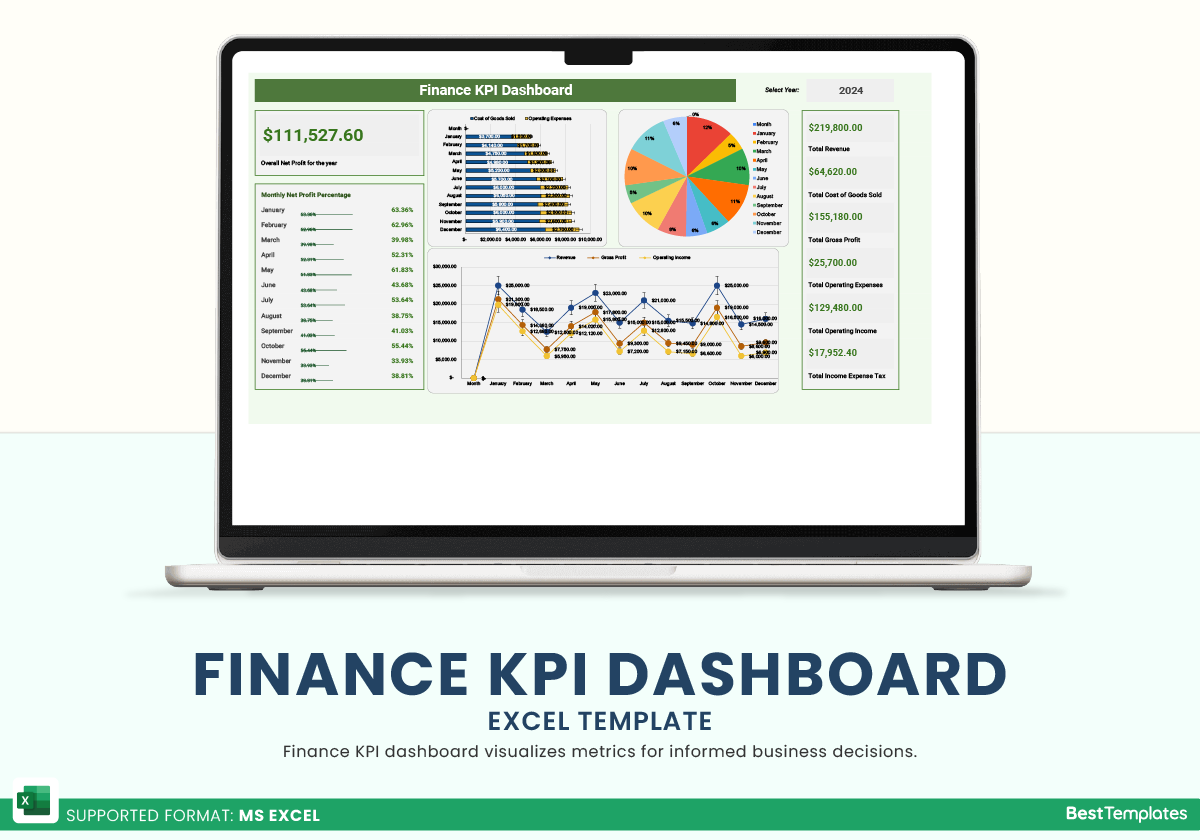
Introducing the Finance KPI Dashboard Excel Template from Besttemplates.com, an advanced tool designed to track and visualize key financial metrics that are critical to your business’s success. This dashboard template allows you to monitor and assess financial performance with a clear, real-time view of Revenue, Costs, Gross Profit, Operating Income, and other vital financial indicators over the year.
The Finance KPI Dashboard offers a highly visual layout with several dynamic charts, including bar graphs, line charts, and pie charts, providing a holistic view of your financial status. The Net Profit for the year is prominently displayed alongside monthly net profit percentages, making it easy to gauge overall profitability. The detailed breakdown of the Cost of Goods Sold (COGS), Operating Expenses, and Total Gross Profit gives you clear insight into where your money is coming from and where it’s going.
With automatic calculations for Total Revenue, Operating Income, Taxes, and more, this template streamlines your financial reporting process, ensuring that you can make data-driven decisions quickly and confidently. The dashboard is perfect for CFOs, financial managers, and business owners who need an effective tool to measure performance against financial goals.
Key Features:
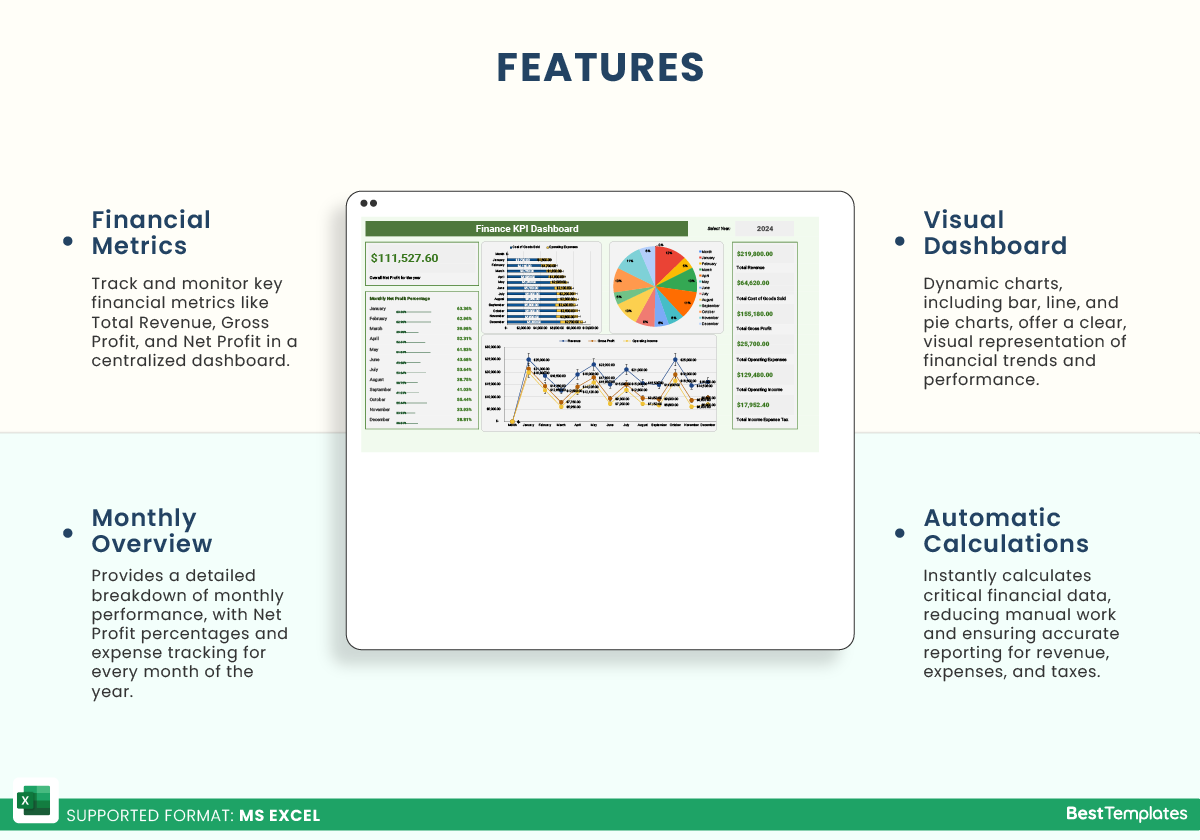
- Comprehensive Financial Metrics: Track key metrics such as Total Revenue, Gross Profit, Operating Income, COGS, and Net Profit in one place.
- Visual Dashboard: Dynamic charts, including pie, bar, and line graphs, to visualize trends and performance over time.
- Monthly Performance Overview: View monthly Net Profit Percentage and detailed revenue and expense breakdowns for each month.
- Automatic Calculations: Instantly calculates essential financial figures such as revenue, expenses, and taxes, saving time and reducing errors.
- Yearly Comparison: Switch between different years (2024, 2025) to compare performance and track financial growth.
- Professional Layout: Clean and intuitive design, perfect for professional presentations or internal financial reviews.
- Data-Driven Decision Making: Use key performance indicators (KPIs) to analyze your financial health and guide strategic planning.
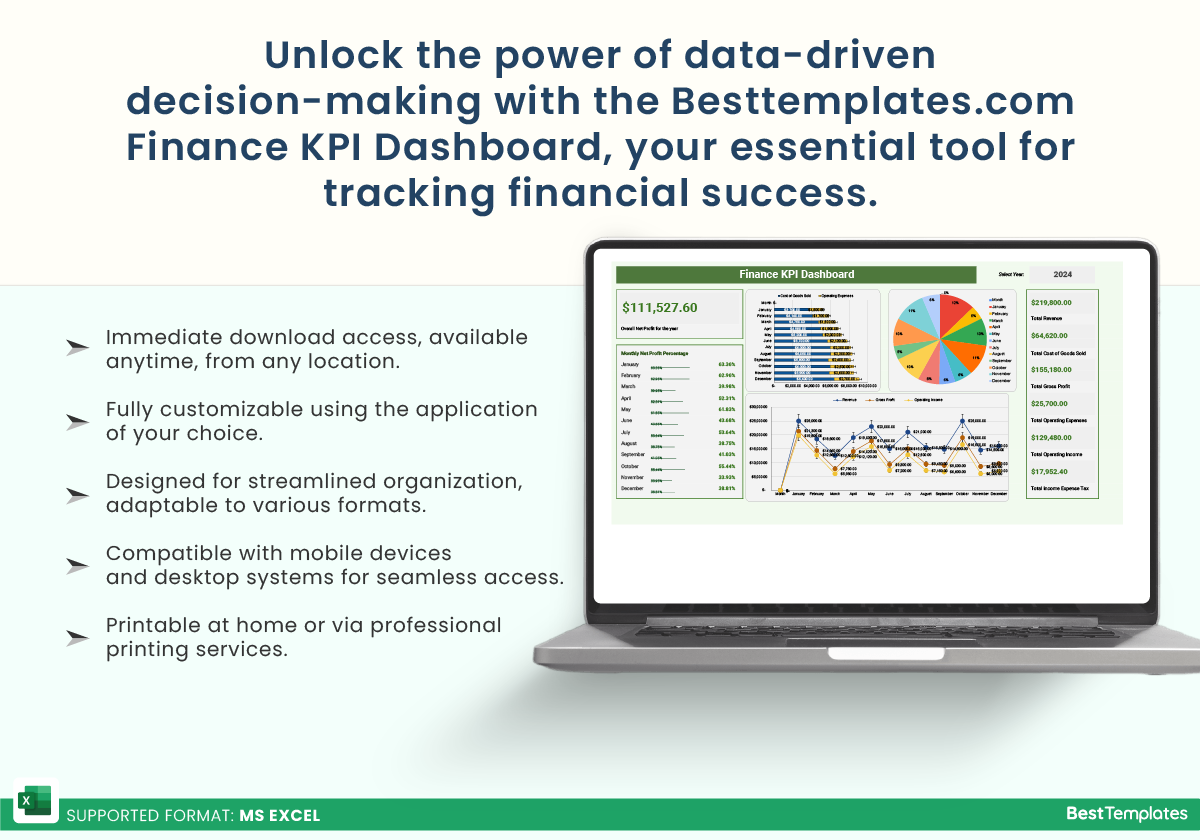
With the Besttemplates.com Finance KPI Dashboard Excel Template, you can monitor, measure, and improve your financial performance with ease. This template is the perfect tool for maintaining a clear overview of your business’s financial health, ensuring you stay on top of your financial goals and make well-informed decisions.




 No products in the cart.