Trend Analysis Excel Template
$9.00
Available in stock
Already have an account? Login
Add to cart| Available Formats | MS Excel |
|---|
Description
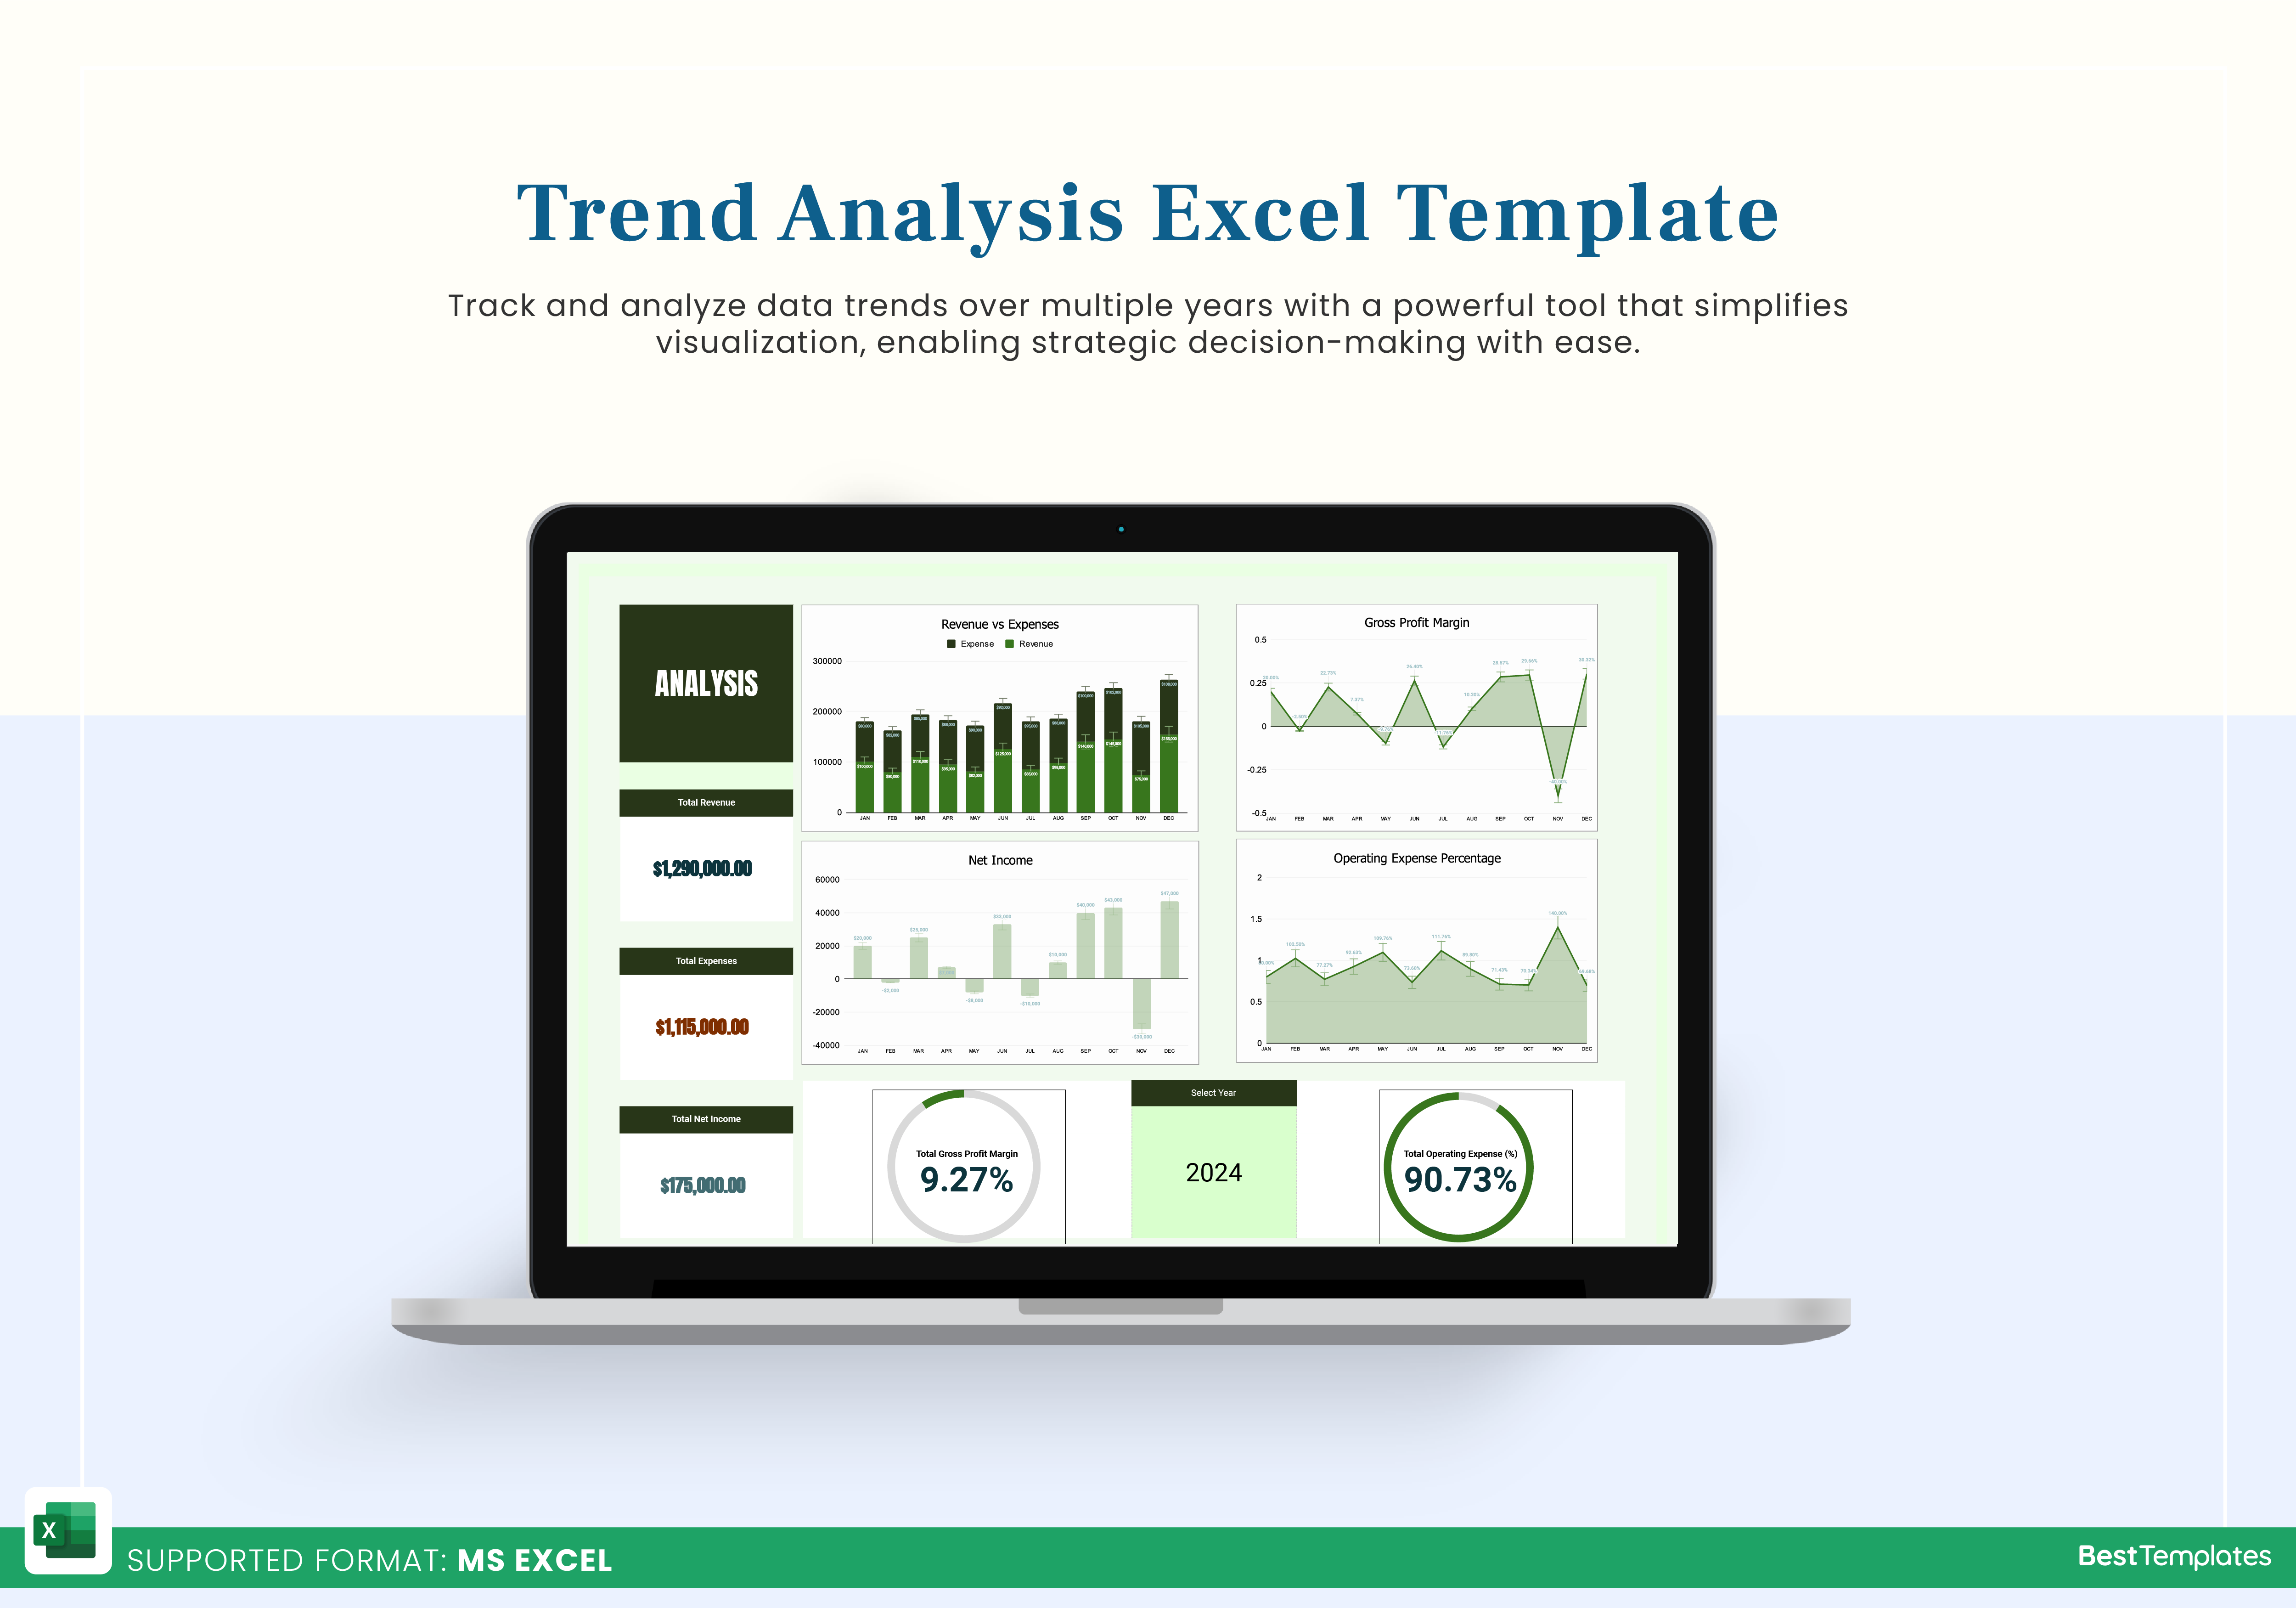
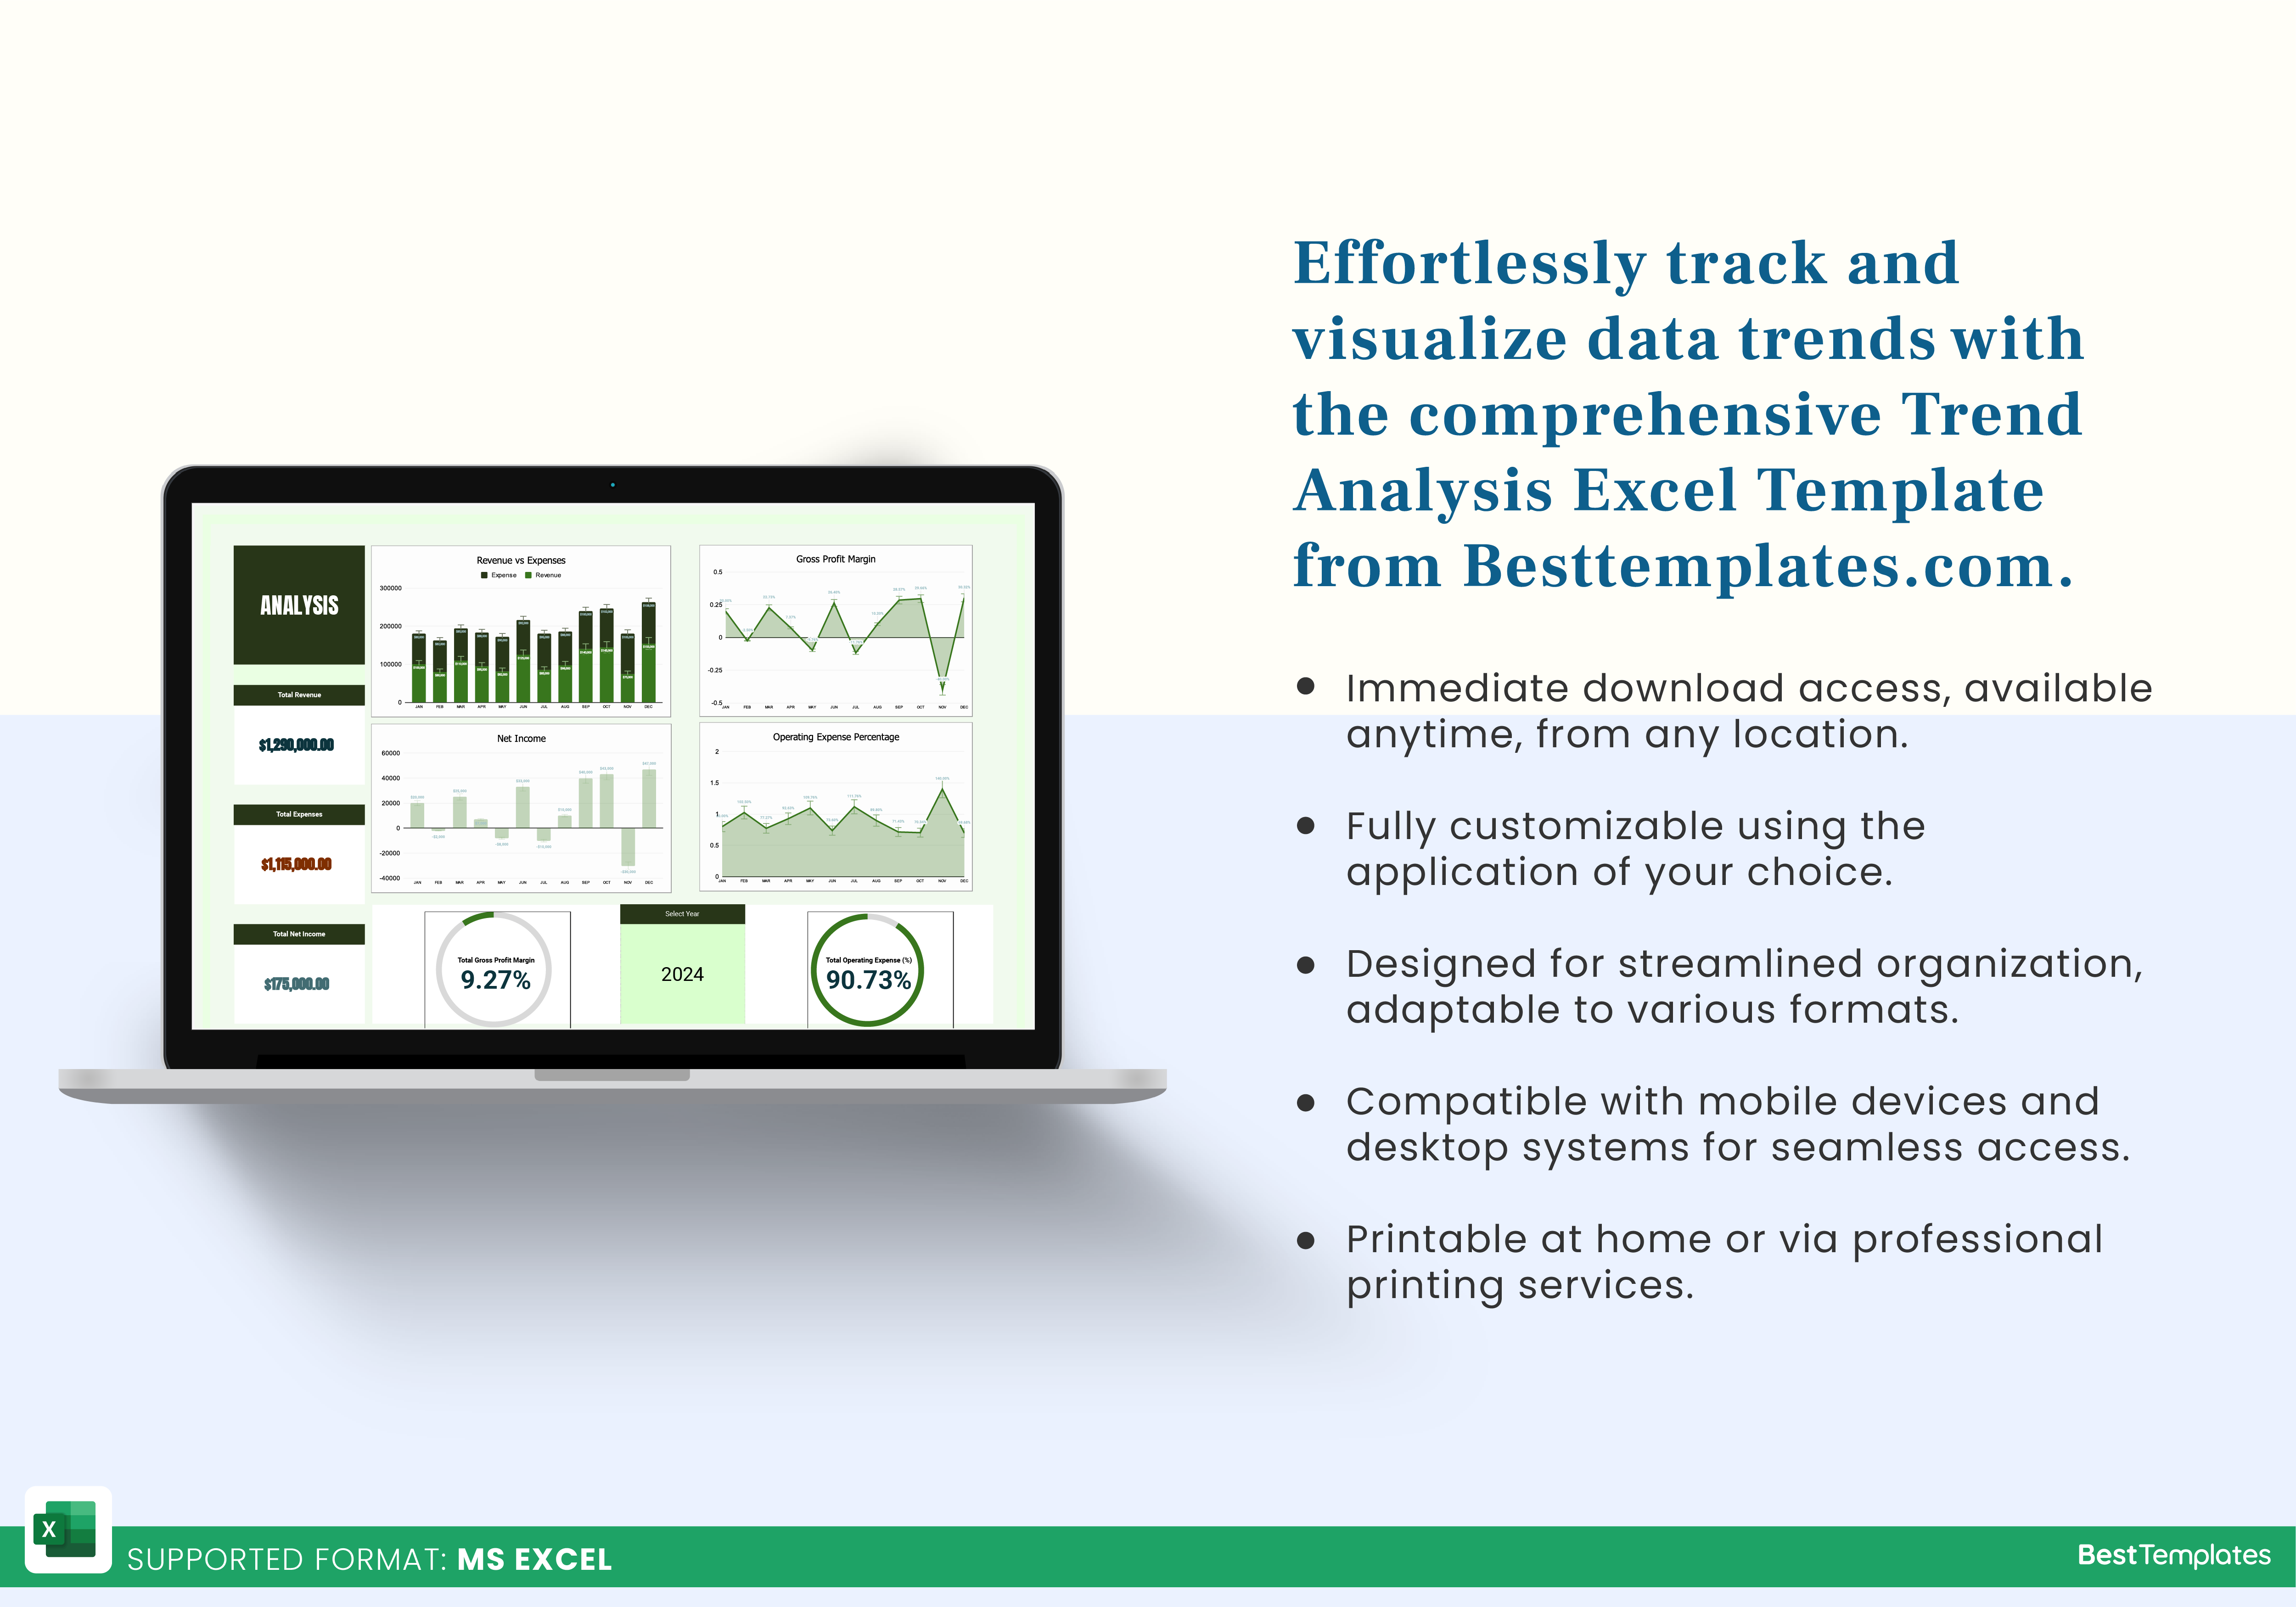
The Trend Analysis Excel Template from Besttemplates.com is the perfect tool for tracking and analyzing data trends over time. Designed for businesses and individuals alike, this template simplifies the process of visualizing changes in your data across multiple years, giving you insights into patterns and shifts that are crucial for strategic decision-making. With its dynamic features and user-friendly design, this template helps you easily manage and interpret complex datasets without any hassle.
Key Features:
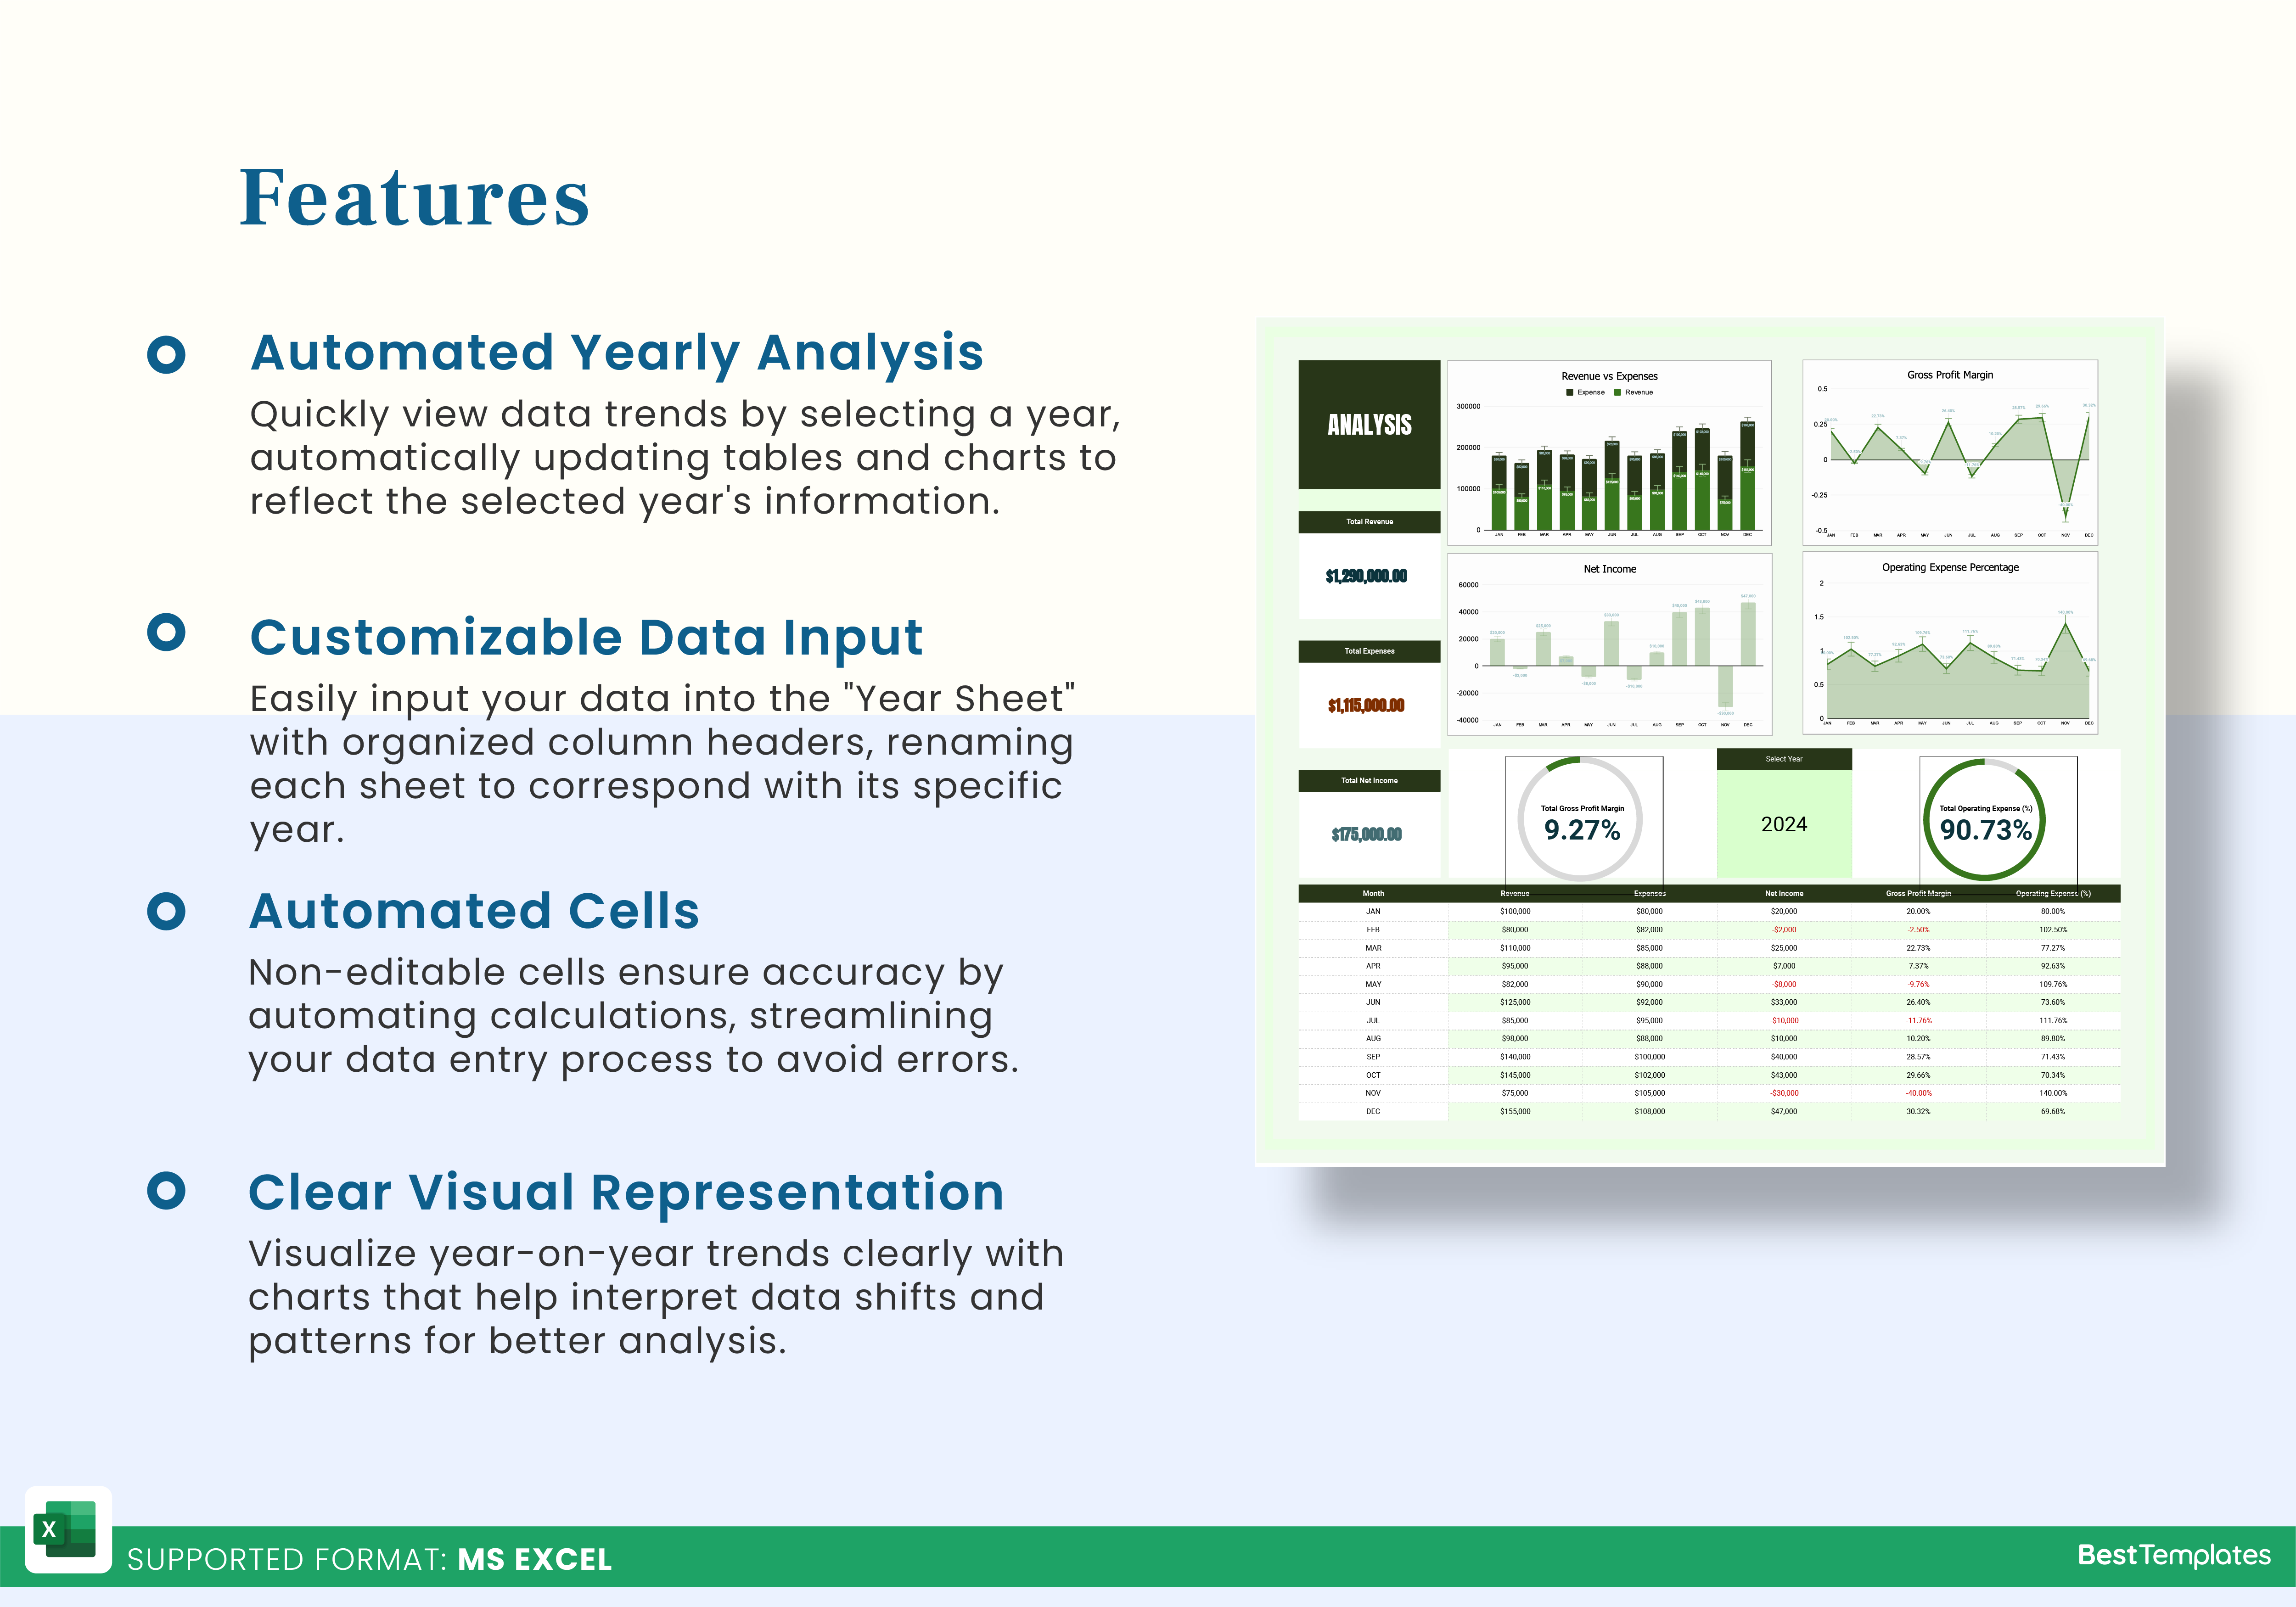
- Automated Yearly Analysis: In the main “Trend Analysis” sheet, simply select a year from the dropdown menu, and both the table and charts will instantly update to reflect the selected year’s data.
- Customizable Data Input: The “Year Sheet” allows you to input your data based on the provided column headers. You can also change the sheet’s name to correspond with each year for a more organized workflow.
- Automated Cells: Highlighted cells in the “Year Sheet” are fully automated to ensure accuracy and are not editable to prevent errors, streamlining your data input process.
This template makes it effortless to compare year-on-year data trends. It’s an ideal solution for businesses looking to enhance their analytical capabilities, providing a clear and concise visual representation of how your data evolves over time. Get started with Besttemplates.com today and unlock the power of efficient trend analysis.
Additional Information
| Available Formats | MS Excel |
|---|
Additional Product Info
- Compatibility: Excel 2021, Office 365
- Functionality: No VBA Macros or custom scripts needed
- Orientation Options: Portrait/Landscape
- Color Mode: RGB Color Space
- License Type: Standard License
- Customization: Easily editable and customizable
- Font Style: Business standard fonts are used
- Digital Optimization: Optimized for digital use only
- Printing Suitability: Suitable for printing


 No products in the cart.