Sales Trend Analysis Excel Template
$9.00
Available in stock
Already have an account? Login
Add to cart| Available Formats | MS Excel |
|---|
Description
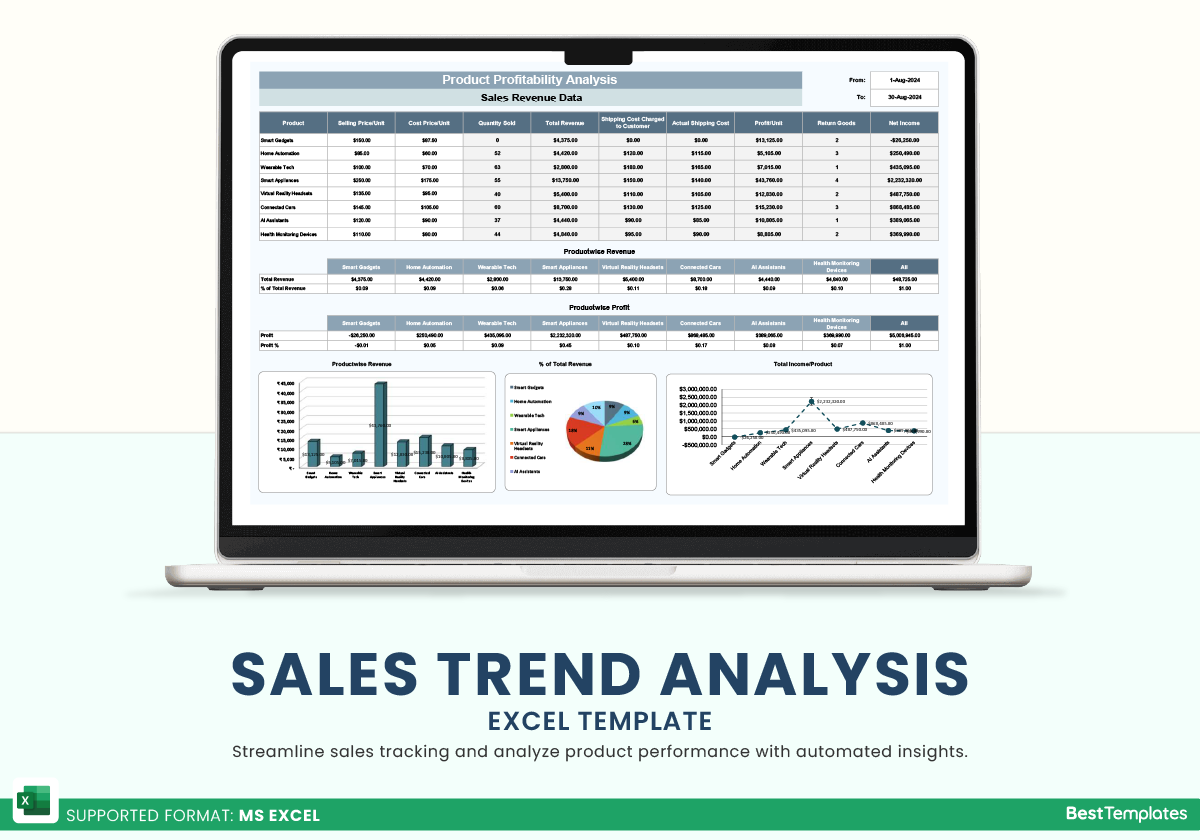
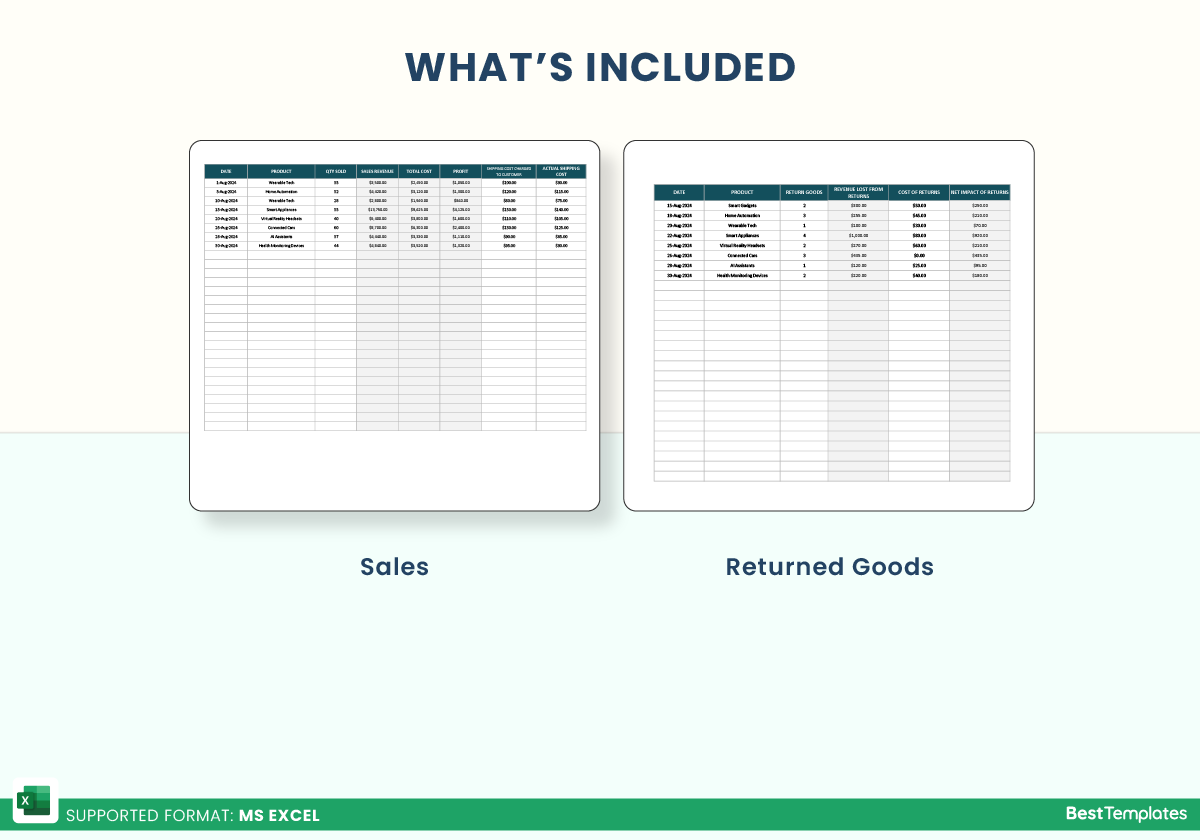
The Sales Trend Analysis Excel Template from Besttemplates.com is designed to streamline your sales tracking and provide in-depth insights into product performance. With this template, you can monitor key sales data, returns, and profitability with ease. In the Returned Goods sheet, you can log the date, returned goods, and cost of returns, while choosing a product from a dropdown. The template automatically calculates the revenue lost from returns and the net impact of those returns. On the Sales sheet, log the date, quantity sold, shipping cost charged to the customer, and actual shipping cost, with a dropdown to select the product. The sales revenue, total cost, and profit are already calculated for you.
Key Features:
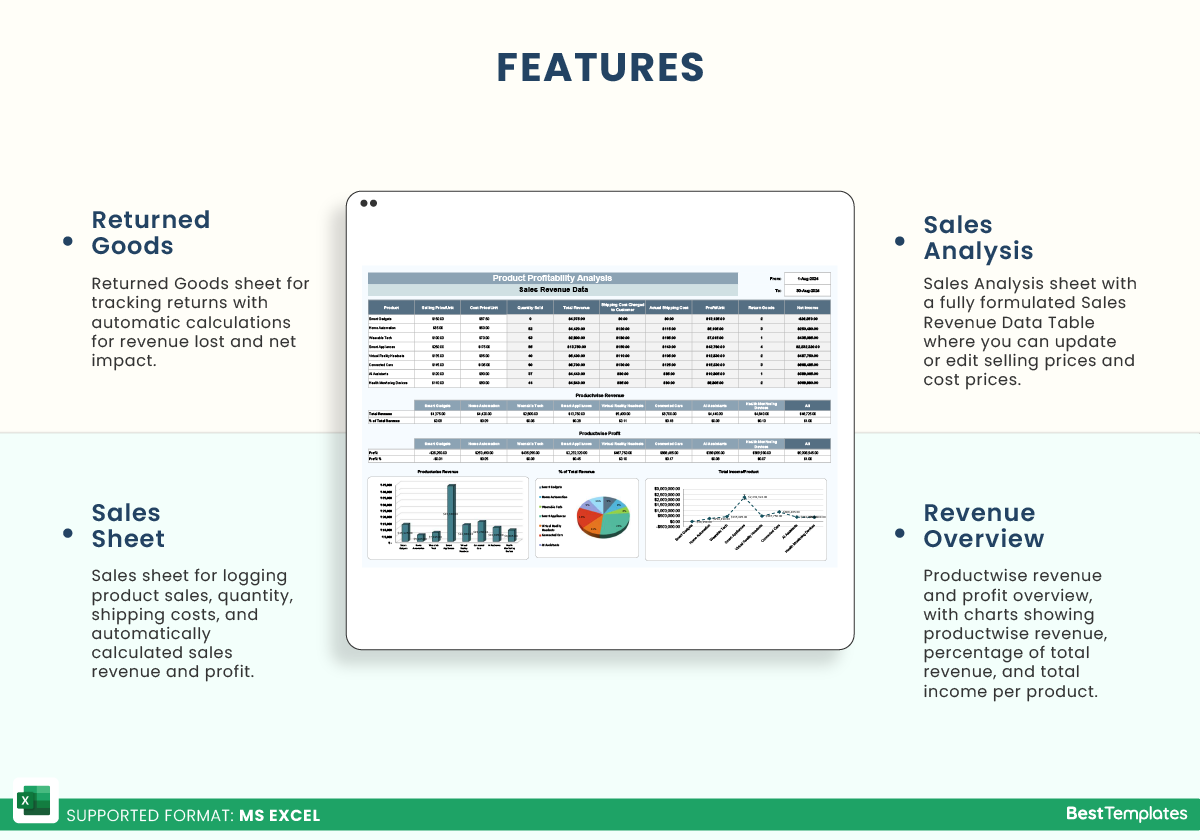
- Returned Goods sheet for tracking returns with automatic calculations for revenue lost and net impact.
- Sales sheet for logging product sales, quantity, shipping costs, and automatically calculated sales revenue and profit.
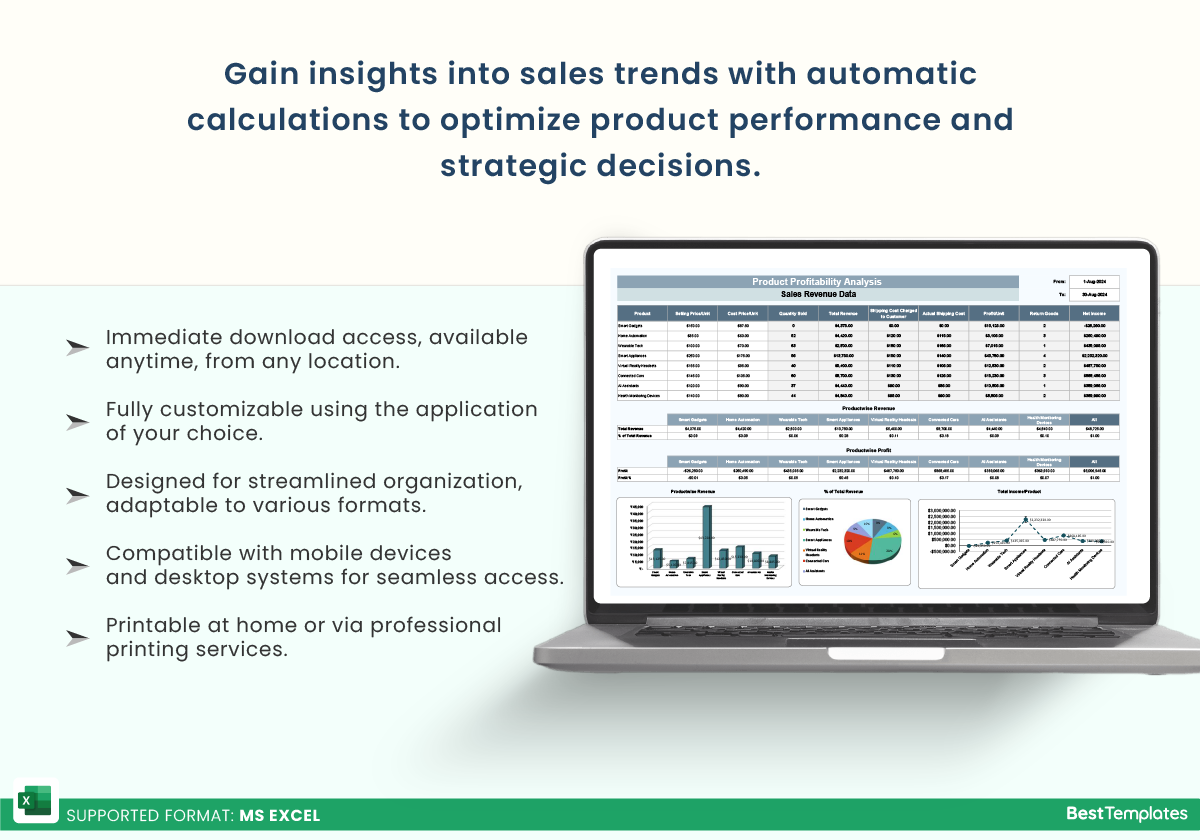
- Sales Analysis sheet with a fully formulated Sales Revenue Data Table where you can update or edit selling prices and cost prices.
- Productwise revenue and profit overview, with charts showing productwise revenue, percentage of total revenue, and total income per product.
- Visual representation of sales performance with charts to highlight trends and profitability.
This template from Besttemplates.com provides a complete view of your sales trends, making it easier to understand product performance and drive strategic decisions. With automatic calculations and visual data representation, you can optimize your sales operations more effectively.
Additional Information
| Available Formats | MS Excel |
|---|
Additional Product Info
- Compatibility: Excel 2021, Office 365
- Functionality: No VBA Macros or custom scripts needed
- Orientation Options: Portrait/Landscape
- Color Mode: RGB Color Space
- License Type: Standard License
- Customization: Easily editable and customizable
- Font Style: Business standard fonts are used
- Digital Optimization: Optimized for digital use only
- Printing Suitability: Suitable for printing


 No products in the cart.