IT Financial Investment Analysis Excel Template
$9.00
Available in stock
Already have an account? Login
Add to cart| Available Formats | MS Excel |
|---|
Description
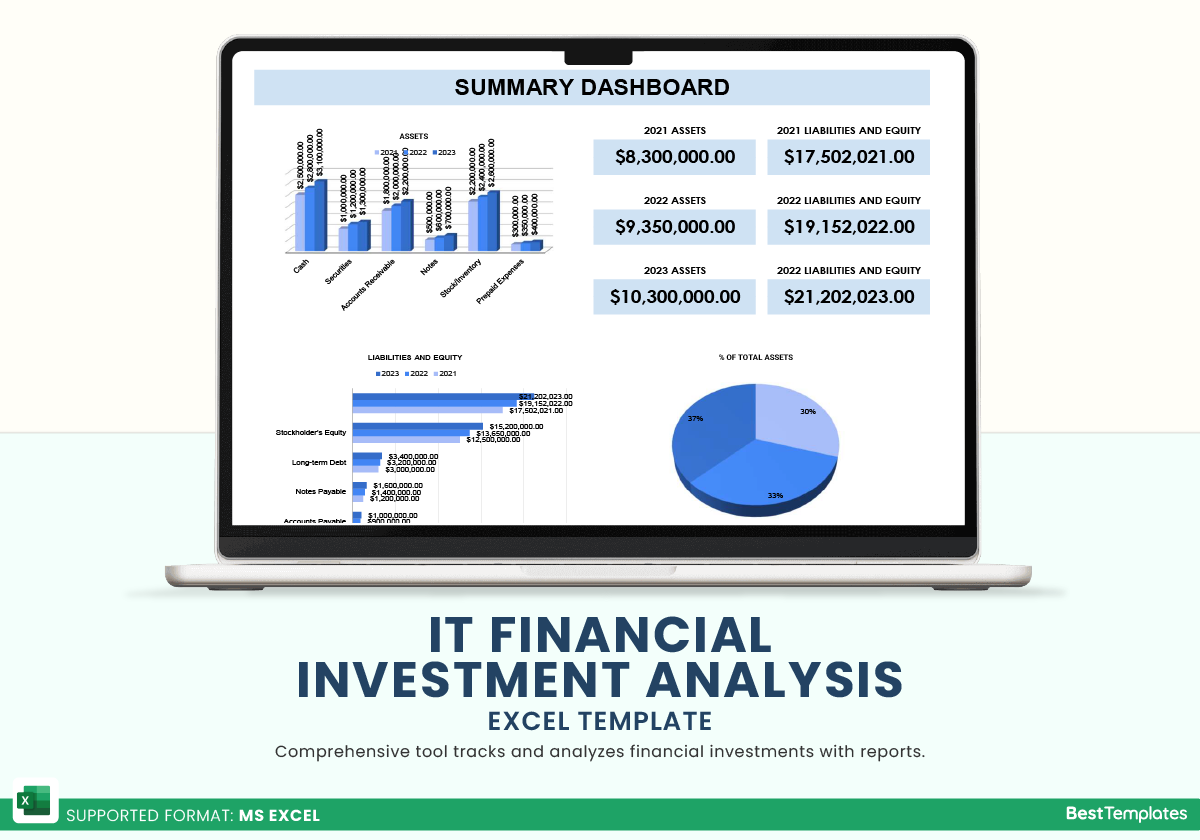
Introducing the IT Financial Investment Analysis Excel Template, exclusively from Besttemplates.com, designed for business professionals and financial analysts who need an intuitive, comprehensive tool for tracking and analyzing financial investments. This template allows users to track assets, liabilities, and equity for multiple years with precision, offering detailed insights into the financial health of a company or investment portfolio.
Key Features:
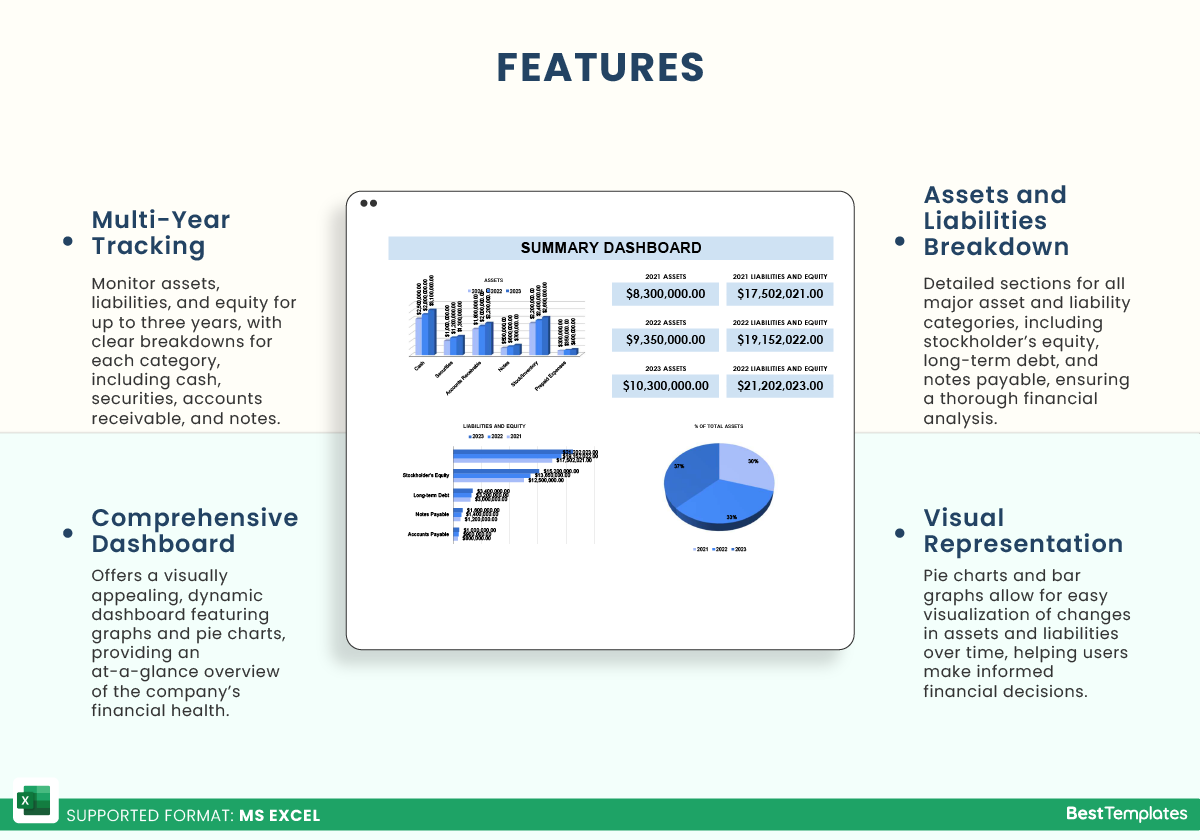
- Multi-Year Tracking: Monitor assets, liabilities, and equity over three years with clear breakdowns for each category, including cash, securities, accounts receivable, notes, and more.
- Comprehensive Dashboard: Get a bird’s-eye view of your financial data with a visually appealing dashboard featuring dynamic graphs and pie charts for a quick snapshot of your company’s financial position.
- Assets and Liabilities Breakdown: Detailed sections for all major categories of assets and liabilities, including stockholder’s equity, long-term debt, and notes payable.
- Visual Representation: Pie charts and bar graphs allow for easy visualization of assets and liabilities, giving you a clear understanding of changes over time.
- Simple & Easy to Use: Navigate between sheets, including the summary dashboard and detailed investment analysis, for a seamless experience.
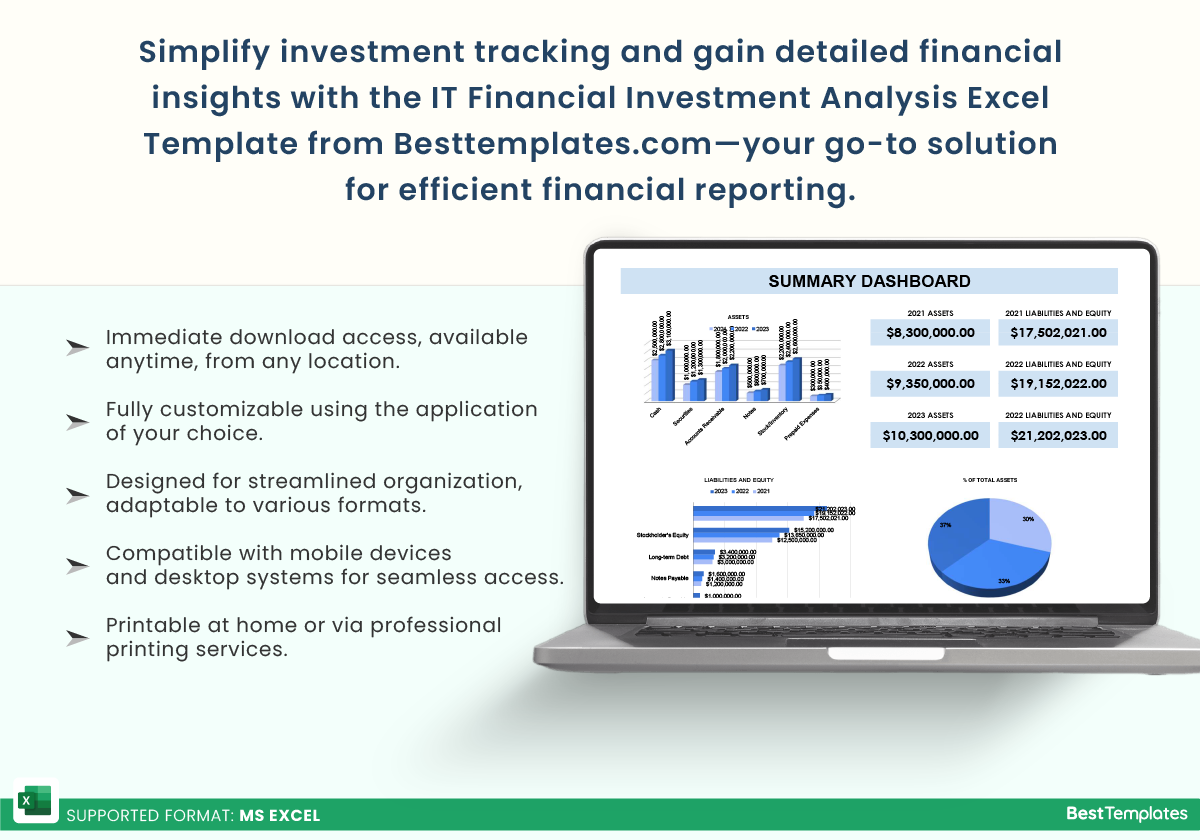
This template is an invaluable resource for financial professionals seeking to manage investments efficiently. Download the IT Financial Investment Analysis Excel Template today at Besttemplates.com and simplify your financial reporting.
Additional Information
| Available Formats | MS Excel |
|---|
Additional Product Info
- Compatibility: Excel 2021, and Office 365
- Functionality: Auto Formulated
- Orientation Options: Portrait
- Color Mode: RGB Color Space
- License Type: Standard License
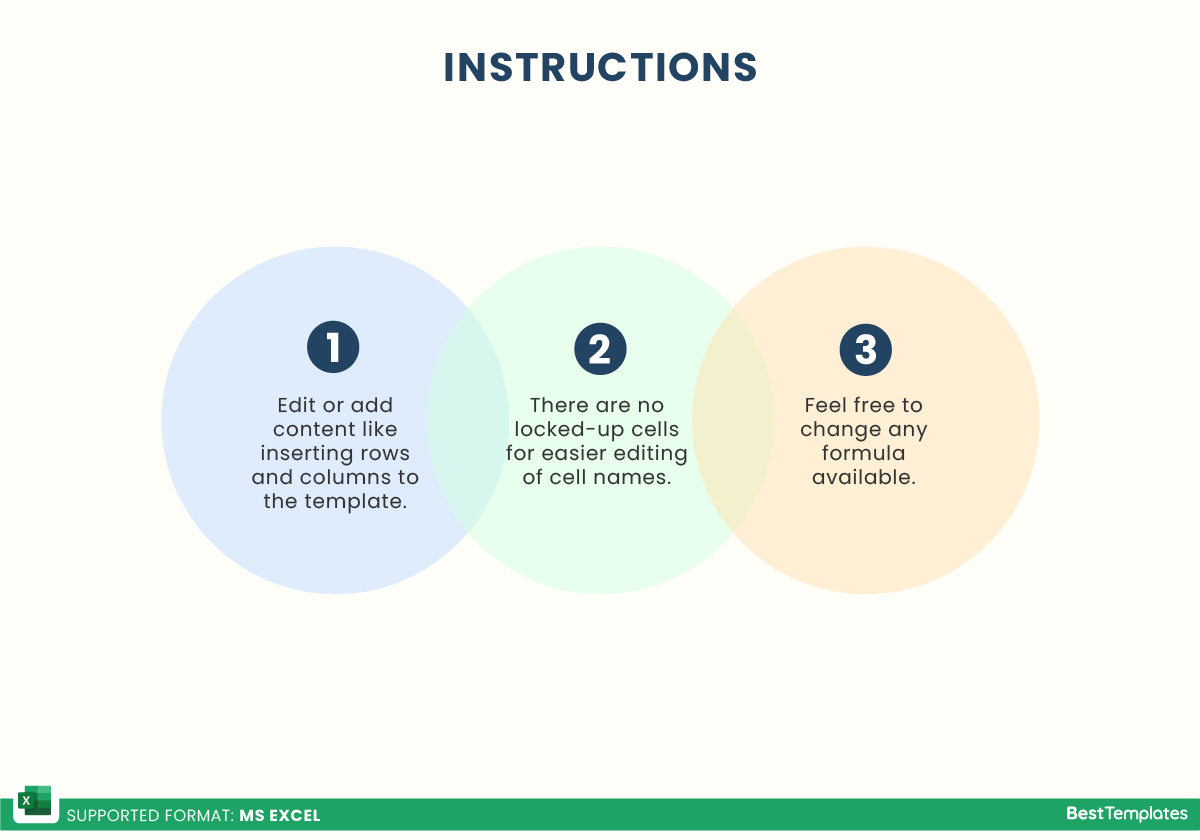
- Customization: Easily editable and customizable
- Font Style: Business standard fonts are used
- Digital Optimization: Optimized for digital use only


 No products in the cart.